Results
| Country: | U.S.A.
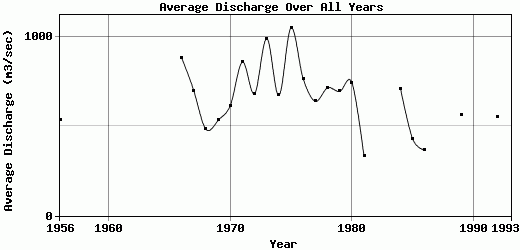
| | Station: | KEOSAUQUA, IA | | River: | DES MOINES RIVER | | Area: | 36356.27 | | Lat: | 40.72 | | Lon: | -91.96 | | Source: | USGS | | PointID: | 5490500 | | Area Units: | km2 | | Discharge Units: | m3/sec | | Starting Year: | 1956 | | Ending Year: | 1993 | | Total Years: | 38 | | Total Usable Years: | 23 | |
| |
| Year | Jan | Feb | Mar | Apr | May | Jun | Jul | Aug | Sep | Oct | Nov | Dec | Avg Annual |
|---|
| 1956 | 321.81 | 760.75 | 975.2 | 878.58 | 555.84 | 355.94 | 478.47 | 344.74 | 389.26 | 498.56 | 332.63 | 494.27 | 532.17 |
| 1957 | -9999 | -9999 | -9999 | -9999 | -9999 | -9999 | -9999 | -9999 | -9999 | -9999 | -9999 | -9999 | -9999 |
| 1958 | -9999 | -9999 | -9999 | -9999 | -9999 | -9999 | -9999 | -9999 | -9999 | -9999 | -9999 | -9999 | -9999 |
| 1959 | -9999 | -9999 | -9999 | -9999 | -9999 | -9999 | -9999 | -9999 | -9999 | -9999 | -9999 | -9999 | -9999 |
| 1960 | -9999 | -9999 | -9999 | -9999 | -9999 | -9999 | -9999 | -9999 | -9999 | -9999 | -9999 | -9999 | -9999 |
| 1961 | -9999 | -9999 | -9999 | -9999 | -9999 | -9999 | -9999 | -9999 | -9999 | -9999 | -9999 | -9999 | -9999 |
| 1962 | -9999 | -9999 | -9999 | -9999 | -9999 | -9999 | -9999 | -9999 | -9999 | -9999 | -9999 | -9999 | -9999 |
| 1963 | -9999 | -9999 | -9999 | -9999 | -9999 | -9999 | -9999 | -9999 | -9999 | -9999 | -9999 | -9999 | -9999 |
| 1964 | -9999 | -9999 | -9999 | -9999 | -9999 | -9999 | -9999 | -9999 | -9999 | -9999 | -9999 | -9999 | -9999 |
| 1965 | -9999 | -9999 | -9999 | -9999 | -9999 | -9999 | -9999 | -9999 | -9999 | -9999 | -9999 | -9999 | -9999 |
| 1966 | 1011.19 | 1670.91 | 2141.04 | 845.64 | 860.29 | 776.92 | 483.03 | 625.26 | 442.22 | 465.77 | 666.02 | 577.48 | 880.48 |
| 1967 | 1444.08 | 1090.2 | 804.29 | 504.42 | 438.46 | 502.82 | 694.77 | 528.25 | 628.92 | 397.9 | 502.94 | 833.25 | 697.53 |
| 1968 | 922.13 | 561.46 | 890.34 | 599.94 | 428.87 | 398.99 | 360.63 | 346.93 | 314.32 | 280.06 | 297.33 | 388.22 | 482.44 |
| 1969 | 494.45 | 591.72 | 706.74 | 937.58 | 654.21 | 436.84 | 395.07 | 448.78 | 531.6 | 417.9 | 350.75 | 410.78 | 531.37 |
| 1970 | 572.19 | 733.81 | 1134.69 | 1237.17 | 430.14 | 530.38 | 422.65 | 582.87 | 427.59 | 358.35 | 476.29 | 453.8 | 613.33 |
| 1971 | 879.47 | 1017.19 | 2550.89 | 875.13 | 940.4 | 505.46 | 636.4 | 821.01 | 468.93 | 390.32 | 350.09 | 849.05 | 857.03 |
| 1972 | 1300.3 | 1313.62 | 992.56 | 682.72 | 482.85 | 540.48 | 596.67 | 412.97 | 337.26 | 305.82 | 314.89 | 881.12 | 680.11 |
| 1973 | 1299.48 | 1940.73 | 1318.84 | 2151.62 | 1122.81 | 1227.92 | 580.04 | 557.02 | 429.85 | 366.75 | 360.29 | 492.9 | 987.35 |
| 1974 | 1026.35 | 1645.32 | 760.08 | 1175.44 | 526.42 | 473.65 | 363.74 | 457.46 | 462.89 | 325.55 | 312.9 | 517.93 | 670.64 |
| 1975 | 1077.32 | 1487.75 | 1977.53 | 2215.14 | 840.19 | 783.63 | 738.43 | 823.11 | 550.01 | 793.52 | 662.62 | 624.8 | 1047.84 |
| 1976 | 869.61 | 1010.04 | 1012.84 | 892.55 | 975.93 | 843.94 | 611.1 | 444.49 | 403.23 | 448.78 | 478.46 | 1158.35 | 762.44 |
| 1977 | 943.69 | 658.88 | 1390.27 | 1146.93 | 483.02 | 376.91 | 324.18 | 376.25 | 387.85 | 326.92 | 692.92 | 551.18 | 638.25 |
| 1978 | 1153.69 | 1474.41 | 1337.2 | 733.69 | 1046.18 | 561.53 | 388.58 | 587.62 | 375.96 | 308.66 | 284.84 | 309.22 | 713.46 |
| 1979 | 567.89 | 981.59 | 1403.15 | 1225.28 | 805.66 | 462.51 | 453.8 | 421.83 | 494.51 | 517.47 | 484.79 | 503.77 | 693.52 |
| 1980 | 554.01 | 739.17 | 1776.12 | 2105.37 | 1021.15 | 640.91 | 458.28 | 399.64 | 353.87 | 292.12 | 286.66 | 286.82 | 742.84 |
| 1981 | 283.17 | 636.91 | 476.82 | 596.73 | 301.9 | 288.47 | 278.63 | 273.36 | 266.42 | 196.23 | 152.25 | 218.25 | 330.76 |
| 1982 | -9999 | -9999 | -9999 | -9999 | -9999 | -9999 | -9999 | -9999 | -9999 | -9999 | -9999 | -9999 | -9999 |
| 1983 | -9999 | -9999 | -9999 | -9999 | -9999 | -9999 | -9999 | -9999 | -9999 | -9999 | -9999 | -9999 | -9999 |
| 1984 | 1054.58 | 1097.92 | 1366.98 | 1001.76 | 841.38 | 508.38 | 468.33 | 765.66 | 436.27 | 304 | 303.18 | 362.09 | 709.21 |
| 1985 | 366.48 | 814.32 | 611.37 | 447.88 | 349.4 | 292.49 | 278.18 | 383.38 | 386.9 | 280.5 | 361.37 | 559.4 | 427.64 |
| 1986 | 532.82 | 694.58 | 624.98 | 384.73 | 280.35 | 253.27 | 221.04 | 168.86 | 190.74 | 179.29 | 280.81 | 578.31 | 365.82 |
| 1987 | -9999 | -9999 | -9999 | -9999 | -9999 | -9999 | -9999 | -9999 | -9999 | -9999 | -9999 | -9999 | -9999 |
| 1988 | -9999 | -9999 | -9999 | -9999 | -9999 | -9999 | -9999 | -9999 | -9999 | -9999 | -9999 | -9999 | -9999 |
| 1989 | 312.31 | 288.43 | 446.31 | 759.84 | 404.29 | 703.3 | 977.94 | 512.26 | 409.75 | 548.89 | 510.37 | 863.3 | 561.42 |
| 1990 | -9999 | -9999 | -9999 | -9999 | -9999 | -9999 | -9999 | -9999 | -9999 | -9999 | -9999 | -9999 | -9999 |
| 1991 | -9999 | -9999 | -9999 | -9999 | -9999 | -9999 | -9999 | -9999 | -9999 | -9999 | -9999 | -9999 | -9999 |
| 1992 | 574.2 | 789.65 | 829.69 | 587.2 | 359.42 | 380.86 | 373.78 | 387.85 | 425.98 | 410.41 | 611.65 | 860.01 | 549.23 |
| 1993 | -9999 | -9999 | -9999 | -9999 | -9999 | -9999 | -9999 | -9999 | -9999 | -9999 | -9999 | -9999 | -9999 |
| |
|
|
|
|
|
|
|
|
|
|
|
|
|
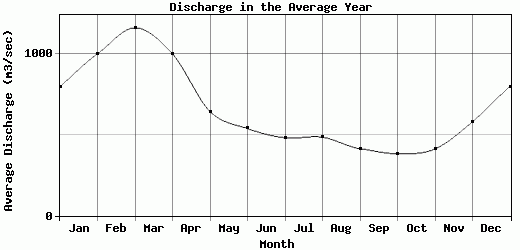
| Avg | 798.24 | 999.97 | 1160.36 | 999.33 | 643.14 | 538.44 | 481.08 | 484.98 | 414.29 | 382.44 | 412.46 | 580.65 | 657.95 |
| |
|
|
|
|
|
|
|
|
|
|
|
|
|
| Std Dev | 345.59 |
416.31 |
542.64 |
518.08 |
266.63 |
219.04 |
172.93 |
163.6 |
92.18 |
129.98 |
144.26 |
230.33 |
179.47 |
| |
|
|
|
|
|
|
|
|
|
|
|
|
|
| | Jan | Feb | Mar | Apr | May | Jun | Jul | Aug | Sep | Oct | Nov | Dec | Avg Annual |
Click here for this table in tab-delimited format.
Tab-delimited format will open in most table browsing software, i.e. Excel, etc.
View this station on the map.
Return to start.