Results
| Country: | U.S.A.
| | Station: | SAYLORVILLE, IA | | River: | DES MOINES RIVER | | Area: | 15127.29 | | Lat: | 41.67 | | Lon: | -93.67 | | Source: | USGS | | PointID: | 5481650 | | Area Units: | km2 | | Discharge Units: | m3/sec | | Starting Year: | 1952 | | Ending Year: | 1993 | | Total Years: | 42 | | Total Usable Years: | 37 | |
| |
| Year | Jan | Feb | Mar | Apr | May | Jun | Jul | Aug | Sep | Oct | Nov | Dec | Avg Annual |
|---|
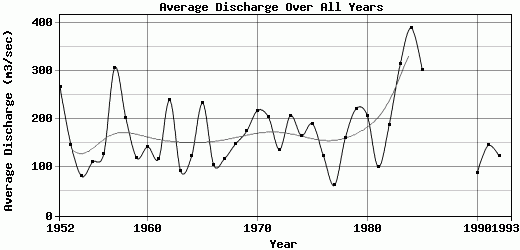
| 1952 | 80.15 | 68.85 | 79.57 | 319.71 | 863.76 | 1021.77 | 279.98 | 154.36 | 97.05 | 75.97 | 84.93 | 82.41 | 267.38 |
| 1953 | 79.27 | 71.19 | 79.33 | 100.72 | 252.17 | 624.41 | 151.23 | 110.09 | 60.66 | 72.14 | 90.02 | 69.43 | 146.72 |
| 1954 | 70.15 | 65.74 | 69.76 | 85.33 | 177.15 | 98.56 | 66.3 | 42.87 | 70.69 | 90.98 | 76.03 | 62.68 | 81.35 |
| 1955 | 58.25 | 58.34 | 82.32 | 120.78 | 286.74 | 304.62 | 91.55 | 76.55 | 51.36 | 54.7 | 77.19 | 75.04 | 111.45 |
| 1956 | 66.64 | 64.92 | 79.07 | 143.17 | 442.85 | 404.1 | 72.29 | 47.34 | 38.54 | 54.26 | 72.18 | 58.63 | 128.67 |
| 1957 | 63.65 | 73.26 | 70.61 | 138.12 | 529.79 | 1241.04 | 838 | 260.02 | 124.01 | 119.1 | 124.92 | 100.33 | 306.9 |
| 1958 | 81.59 | 98.7 | 102.65 | 208.96 | 816.05 | 678.38 | 94.83 | 47.9 | 69.01 | 68.07 | 87.05 | 76.88 | 202.51 |
| 1959 | 72.03 | 74.08 | 65.48 | 68.67 | 236.08 | 433.14 | 91.15 | 66.94 | 58.84 | 111.89 | 88.6 | 68.81 | 119.64 |
| 1960 | 70.51 | 66.76 | 110.39 | 244.31 | 316.39 | 475.41 | 106.04 | 46.3 | 53.15 | 70.24 | 81.15 | 72.46 | 142.76 |
| 1961 | 65.91 | 67.49 | 70.97 | 72.46 | 263.34 | 287.81 | 55.57 | 55.74 | 132.92 | 144.86 | 112.65 | 88.05 | 118.15 |
| 1962 | 79.99 | 117.22 | 103.34 | 424.98 | 669.83 | 650.91 | 339.84 | 92.82 | 81.19 | 118.49 | 111.93 | 81.72 | 239.36 |
| 1963 | 74.72 | 89.23 | 85.3 | 92.28 | 214.62 | 147.98 | 49.01 | 69.47 | 78.52 | 61.9 | 82.8 | 58 | 91.99 |
| 1964 | 52.99 | 51.4 | 56.18 | 84.41 | 354.47 | 356.67 | 123.26 | 101.24 | 72.37 | 68.47 | 81.79 | 77.85 | 123.43 |
| 1965 | 73.09 | 67.3 | 68.13 | 189.08 | 478.17 | 740.21 | 483.95 | 187.66 | 160.04 | 141.97 | 107.2 | 101 | 233.15 |
| 1966 | 78.44 | 78.23 | 102.63 | 141.08 | 254.72 | 175.99 | 80.07 | 54.63 | 70.08 | 80.55 | 72.71 | 74.46 | 105.3 |
| 1967 | 63.83 | 67.04 | 79.7 | 89.09 | 195.36 | 324.61 | 139.9 | 72.5 | 82.83 | 80.42 | 103.71 | 118.2 | 118.1 |
| 1968 | 93.85 | 97.46 | 80.28 | 92.27 | 251.88 | 473.73 | 129.45 | 148.62 | 74.84 | 100 | 123.83 | 118.6 | 148.73 |
| 1969 | 123.72 | 94.18 | 115.73 | 249.08 | 381.9 | 323.88 | 194.25 | 89.67 | 113.47 | 154.43 | 136.84 | 118.61 | 174.65 |
| 1970 | 108.18 | 111.58 | 126.36 | 136.04 | 558.41 | 606.83 | 237.83 | 110.08 | 166.76 | 158.64 | 154.22 | 141.64 | 218.05 |
| 1971 | 149.27 | 163.47 | 183.06 | 255.21 | 327.6 | 509.89 | 239.44 | 109.85 | 132.56 | 123.28 | 130.82 | 122.99 | 203.95 |
| 1972 | 109.97 | 110.54 | 119.19 | 94.14 | 209.15 | 348.55 | 88.78 | 60.36 | 102.46 | 130.93 | 137.96 | 131.08 | 136.93 |
| 1973 | 127.31 | 101.73 | 102.02 | 105.64 | 501.37 | 610.04 | 327.64 | 146.76 | 102.35 | 112.9 | 115.81 | 135.47 | 207.42 |
| 1974 | 143.66 | 151 | 167.65 | 154.37 | 431.28 | 343.07 | 135.38 | 72.04 | 75.98 | 94 | 119.19 | 103.53 | 165.93 |
| 1975 | 108.99 | 108.26 | 110.69 | 145.97 | 372.34 | 529.81 | 332.73 | 105.13 | 92.58 | 111.72 | 136.33 | 130.82 | 190.45 |
| 1976 | 113.26 | 106.7 | 103.59 | 100.67 | 250.4 | 251.49 | 101.45 | 70.53 | 84.19 | 100.86 | 104.14 | 102.48 | 124.15 |
| 1977 | 95.58 | 77.32 | 57.28 | 46.18 | 64.64 | 76.13 | 47.06 | 38.23 | 59.86 | 62.23 | 66.92 | 61.68 | 62.76 |
| 1978 | 64.42 | 67.47 | 80.16 | 148.95 | 326.9 | 557.28 | 223.07 | 69.61 | 85.22 | 90.88 | 112.56 | 108.55 | 161.26 |
| 1979 | 108.43 | 128.24 | 156.57 | 224.11 | 528.24 | 644.49 | 327.83 | 121.98 | 101.78 | 102.35 | 105.44 | 115.31 | 222.06 |
| 1980 | 113.15 | 117.19 | 118.05 | 185.5 | 574.74 | 631.19 | 202.27 | 87.02 | 100.11 | 106.91 | 129.47 | 121.68 | 207.27 |
| 1981 | 108.86 | 88.42 | 75.93 | 77.22 | 130.27 | 184.51 | 83.64 | 64.5 | 94.08 | 113.74 | 99.89 | 88.66 | 100.81 |
| 1982 | 84.4 | 108.47 | 120.53 | 136.95 | 349.47 | 463.55 | 248.31 | 145.13 | 162.41 | 162.79 | 147.98 | 129.66 | 188.3 |
| 1983 | 123.54 | 119.22 | 124.14 | 129.51 | 496.77 | 1172.23 | 726.47 | 288.67 | 141.33 | 146.31 | 148.25 | 149 | 313.79 |
| 1984 | 141.08 | 155.77 | 177.5 | 255.34 | 1074.79 | 1221.03 | 637.77 | 273.97 | 191.62 | 200.05 | 183.78 | 160.13 | 389.4 |
| 1985 | 173.56 | 169.78 | 209.58 | 441.75 | 808.95 | 715.76 | 277.2 | 141.94 | 144.95 | 204.17 | 179.89 | 169.69 | 303.1 |
| 1986 | -9999 | -9999 | -9999 | -9999 | -9999 | -9999 | -9999 | -9999 | -9999 | -9999 | -9999 | -9999 | -9999 |
| 1987 | -9999 | -9999 | -9999 | -9999 | -9999 | -9999 | -9999 | -9999 | -9999 | -9999 | -9999 | -9999 | -9999 |
| 1988 | -9999 | -9999 | -9999 | -9999 | -9999 | -9999 | -9999 | -9999 | -9999 | -9999 | -9999 | -9999 | -9999 |
| 1989 | -9999 | -9999 | -9999 | -9999 | -9999 | -9999 | -9999 | -9999 | -9999 | -9999 | -9999 | -9999 | -9999 |
| 1990 | 61.41 | 59.82 | 63.12 | 70.89 | 115.49 | 201.92 | 91.61 | 66.16 | 84.89 | 89.21 | 85.32 | 63.05 | 87.74 |
| 1991 | 64.33 | 80.73 | 76.84 | 105.6 | 300.53 | 405.43 | 149.76 | 101.71 | 123.99 | 110.07 | 123.31 | 103.81 | 145.51 |
| 1992 | 86.56 | 84.77 | 88.41 | 141.25 | 287.88 | 209.97 | 119.95 | 101.28 | 99.02 | 91.26 | 99.43 | 73.9 | 123.64 |
| 1993 | -9999 | -9999 | -9999 | -9999 | -9999 | -9999 | -9999 | -9999 | -9999 | -9999 | -9999 | -9999 | -9999 |
| |
|
|
|
|
|
|
|
|
|
|
|
|
|
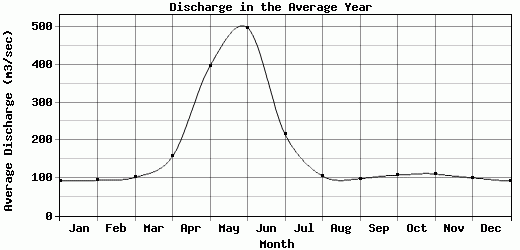
| Avg | 92.83 | 94.1 | 101.68 | 157.29 | 397.15 | 498.55 | 215.81 | 105.4 | 98.26 | 107.59 | 110.71 | 100.44 | 173.32 |
| |
|
|
|
|
|
|
|
|
|
|
|
|
|
| Std Dev | 29.15 |
30.35 |
36.64 |
91.23 |
221.83 |
292.96 |
185.4 |
61.48 |
35.73 |
36.91 |
29 |
29.99 |
73.17 |
| |
|
|
|
|
|
|
|
|
|
|
|
|
|
| | Jan | Feb | Mar | Apr | May | Jun | Jul | Aug | Sep | Oct | Nov | Dec | Avg Annual |
Click here for this table in tab-delimited format.
Tab-delimited format will open in most table browsing software, i.e. Excel, etc.
View this station on the map.
Return to start.