Results
| Country: | Ukrainian_S.S.R.
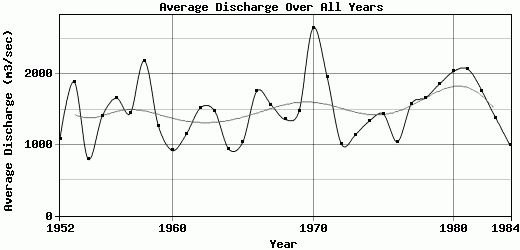
| | Station: | DnieperHydroelectric Plant | | River: | Dnieper | | Area: | 463000 km2 | | Lat: | 47.92 | | Lon: | 35.15 | | Source: | RivDIS | | PointID: | 805 | | Area Units: | km2 | | Discharge Units: | m3/sec | | Starting Year: | 1952 | | Ending Year: | 1984 | | Total Years: | 33 | | Total Usable Years: | 33 | |
| |
| Year | Jan | Feb | Mar | Apr | May | Jun | Jul | Aug | Sep | Oct | Nov | Dec | Avg Annual |
|---|
| 1952 | 435 | 688 | 590 | 1690 | 2570 | 1600 | 844 | 707 | 652 | 851 | 1090 | 1340 | 1088.08 |
| 1953 | 1110 | 1520 | 1510 | 5900 | 5170 | 2510 | 1220 | 889 | 1050 | 790 | 718 | 365 | 1896 |
| 1954 | 476 | 439 | 456 | 1400 | 1970 | 1320 | 724 | 649 | 457 | 574 | 735 | 409 | 800.75 |
| 1955 | 682 | 1320 | 1570 | 2710 | 4300 | 2330 | 897 | 731 | 597 | 646 | 629 | 433 | 1403.75 |
| 1956 | 624 | 857 | 801 | 2610 | 6810 | 2940 | 1030 | 805 | 866 | 1020 | 671 | 911 | 1662.08 |
| 1957 | 771 | 1540 | 2590 | 3270 | 3140 | 1450 | 743 | 624 | 643 | 1100 | 1020 | 475 | 1447.17 |
| 1958 | 747 | 1120 | 2090 | 3010 | 8040 | 3310 | 1450 | 1070 | 1150 | 1340 | 1770 | 1220 | 2193.08 |
| 1959 | 1270 | 1380 | 2140 | 3230 | 3090 | 1310 | 614 | 409 | 461 | 487 | 384 | 436 | 1267.58 |
| 1960 | 552 | 758 | 1360 | 2110 | 1340 | 757 | 507 | 435 | 476 | 583 | 737 | 1470 | 923.75 |
| 1961 | 2210 | 2200 | 2050 | 1360 | 686 | 833 | 687 | 679 | 735 | 719 | 750 | 976 | 1157.08 |
| 1962 | 1080 | 1100 | 1340 | 1890 | 2620 | 2100 | 1490 | 1790 | 1530 | 1200 | 1000 | 1200 | 1528.33 |
| 1963 | 1600 | 2000 | 2090 | 2350 | 3220 | 1600 | 1100 | 734 | 736 | 822 | 682 | 812 | 1478.83 |
| 1964 | 735 | 616 | 702 | 2030 | 1410 | 1020 | 808 | 634 | 574 | 780 | 832 | 1160 | 941.75 |
| 1965 | 1400 | 1090 | 1490 | 1310 | 737 | 668 | 908 | 905 | 901 | 805 | 1050 | 1240 | 1042 |
| 1966 | 1710 | 2230 | 2960 | 5310 | 2940 | 1240 | 866 | 866 | 629 | 664 | 781 | 941 | 1761.42 |
| 1967 | 1650 | 1990 | 2030 | 2860 | 3540 | 1600 | 963 | 723 | 677 | 812 | 1000 | 1020 | 1572.08 |
| 1968 | 1290 | 1580 | 1740 | 2280 | 2210 | 1170 | 730 | 702 | 915 | 1170 | 1230 | 1330 | 1362.25 |
| 1969 | 1460 | 1230 | 1270 | 1740 | 2220 | 2120 | 1310 | 1170 | 843 | 887 | 1570 | 1910 | 1477.5 |
| 1970 | 1980 | 2240 | 3040 | 6210 | 6830 | 2830 | 1290 | 926 | 1140 | 1430 | 1700 | 2260 | 2656.33 |
| 1971 | 2290 | 2290 | 2830 | 3710 | 3290 | 1430 | 1340 | 960 | 810 | 1140 | 1480 | 1920 | 1957.5 |
| 1972 | 2160 | 1800 | 606 | 716 | 854 | 851 | 833 | 823 | 828 | 828 | 904 | 995 | 1016.5 |
| 1973 | 1350 | 1290 | 1120 | 978 | 1400 | 1300 | 819 | 891 | 1100 | 1100 | 1010 | 1340 | 1141.5 |
| 1974 | 1490 | 1520 | 872 | 753 | 816 | 1120 | 1910 | 1630 | 944 | 1010 | 1760 | 2230 | 1337.92 |
| 1975 | 2660 | 2770 | 1820 | 1380 | 2670 | 1420 | 1070 | 780 | 609 | 614 | 619 | 812 | 1435.33 |
| 1976 | 964 | 1730 | 868 | 1060 | 1600 | 1420 | 758 | 672 | 606 | 975 | 864 | 1030 | 1045.58 |
| 1977 | 1380 | 1860 | 1870 | 1410 | 2280 | 1320 | 1150 | 1260 | 1240 | 1530 | 1640 | 2080 | 1585 |
| 1978 | 1390 | 1680 | 2490 | 2550 | 2690 | 1790 | 1240 | 1270 | 620 | 947 | 1310 | 2020 | 1666.42 |
| 1979 | 2050 | 2360 | 2610 | 4830 | 3980 | 1400 | 762 | 964 | 748 | 822 | 1060 | 786 | 1864.33 |
| 1980 | 1710 | 1740 | 925 | 2310 | 2660 | 2660 | 1890 | 2000 | 1850 | 1840 | 2470 | 2440 | 2041.25 |
| 1981 | 2120 | 2770 | 2850 | 3920 | 3190 | 1640 | 1130 | 905 | 840 | 1320 | 2080 | 2100 | 2072.08 |
| 1982 | 1900 | 2230 | 1930 | 1390 | 3190 | 1900 | 1900 | 1530 | 1060 | 1630 | 1540 | 988 | 1765.67 |
| 1983 | 1420 | 1420 | 1670 | 3000 | 3110 | 1360 | 995 | 760 | 742 | 1010 | 362 | 670 | 1376.58 |
| 1984 | 511 | 1510 | 927 | 483 | 898 | 1030 | 922 | 1190 | 740 | 887 | 1230 | 1630 | 996.5 |
| |
|
|
|
|
|
|
|
|
|
|
|
|
|
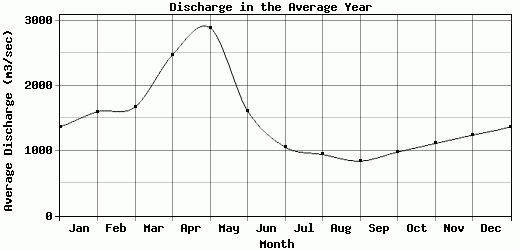
| Avg | 1369 | 1602.06 | 1672.94 | 2477.58 | 2893.06 | 1616.64 | 1057.58 | 941.91 | 841.48 | 979.79 | 1111.45 | 1240.88 | 1483.7 |
| |
|
|
|
|
|
|
|
|
|
|
|
|
|
| Std Dev | 590.35 |
587.34 |
743.68 |
1438.82 |
1737.67 |
647.5 |
357.05 |
361.69 |
297.9 |
315.11 |
483.51 |
587.41 |
416.24 |
| |
|
|
|
|
|
|
|
|
|
|
|
|
|
| | Jan | Feb | Mar | Apr | May | Jun | Jul | Aug | Sep | Oct | Nov | Dec | Avg Annual |
Click here for this table in tab-delimited format.
Tab-delimited format will open in most table browsing software, i.e. Excel, etc.
View this station on the map.
Return to start.