Results
| Country: | Portugal
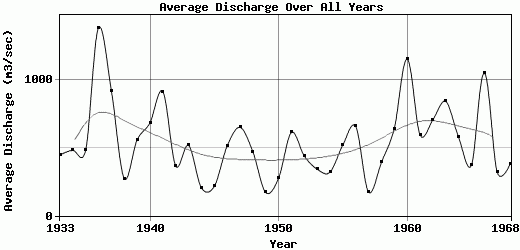
| | Station: | Regua | | River: | Douro | | Area: | 91491 km2 | | Lat: | 41.15 | | Lon: | -7.68 | | Source: | RivDIS | | PointID: | 994 | | Area Units: | km2 | | Discharge Units: | m3/sec | | Starting Year: | 1933 | | Ending Year: | 1968 | | Total Years: | 36 | | Total Usable Years: | 36 | |
| |
| Year | Jan | Feb | Mar | Apr | May | Jun | Jul | Aug | Sep | Oct | Nov | Dec | Avg Annual |
|---|
| 1933 | 1062 | 792 | 1408 | 510 | 396 | 209 | 124 | 64 | 47 | 142 | 253 | 344 | 445.92 |
| 1934 | 517 | 299 | 823 | 1181 | 844 | 334 | 233 | 154 | 104 | 44 | 144 | 1093 | 480.83 |
| 1935 | 556 | 483 | 1028 | 387 | 433 | 436 | 227 | 176 | 153 | 191 | 269 | 1448 | 482.25 |
| 1936 | 3994 | 3958 | 2770 | 3059 | 1084 | 480 | 313 | 100 | 101 | 164 | 272 | 277 | 1381 |
| 1937 | 1151 | 2047 | 2322 | 1324 | 481 | 300 | 130 | 96 | 117 | 203 | 1057 | 1778 | 917.17 |
| 1938 | 882 | 504 | 289 | 221 | 225 | 125 | 116 | 111 | 93 | 75 | 161 | 468 | 272.5 |
| 1939 | 2359 | 828 | 346 | 842 | 270 | 257 | 131 | 100 | 106 | 367 | 644 | 423 | 556.08 |
| 1940 | 1497 | 2450 | 1577 | 420 | 587 | 264 | 116 | 90 | 93 | 167 | 563 | 377 | 683.42 |
| 1941 | 1928 | 2718 | 1988 | 1131 | 1368 | 809 | 212 | 120 | 122 | 129 | 209 | 222 | 913 |
| 1942 | 255 | 273 | 796 | 688 | 716 | 190 | 99 | 123 | 126 | 171 | 290 | 665 | 366 |
| 1943 | 1929 | 1054 | 712 | 472 | 332 | 117 | 116 | 110 | 100 | 384 | 381 | 491 | 516.5 |
| 1944 | 312 | 243 | 307 | 421 | 186 | 181 | 112 | 77 | 69 | 84 | 171 | 297 | 205 |
| 1945 | 277 | 379 | 230 | 163 | 123 | 93 | 78 | 47 | 54 | 49 | 220 | 867 | 215 |
| 1946 | 595 | 508 | 599 | 1004 | 1462 | 690 | 154 | 195 | 184 | 141 | 182 | 414 | 510.67 |
| 1947 | 487 | 1567 | 2290 | 1221 | 654 | 308 | 181 | 143 | 187 | 243 | 198 | 309 | 649 |
| 1948 | 1398 | 1227 | 623 | 460 | 600 | 326 | 171 | 156 | 122 | 108 | 111 | 335 | 469.75 |
| 1949 | 442 | 272 | 126 | 154 | 126 | 99 | 96 | 50 | 62 | 132 | 152 | 339 | 170.83 |
| 1950 | 327 | 552 | 396 | 225 | 283 | 450 | 177 | 139 | 158 | 135 | 138 | 308 | 274 |
| 1951 | 523 | 1137 | 1750 | 719 | 542 | 388 | 151 | 142 | 176 | 227 | 1039 | 546 | 611.67 |
| 1952 | 501 | 526 | 508 | 1060 | 651 | 245 | 176 | 139 | 171 | 182 | 313 | 794 | 438.83 |
| 1953 | 627 | 553 | 455 | 590 | 355 | 182 | 136 | 126 | 125 | 196 | 224 | 539 | 342.33 |
| 1954 | 353 | 511 | 712 | 487 | 485 | 237 | 129 | 133 | 137 | 133 | 193 | 328 | 319.83 |
| 1955 | 832 | 1359 | 873 | 523 | 292 | 180 | 96 | 96 | 136 | 166 | 614 | 1064 | 519.25 |
| 1956 | 1330 | 767 | 1738 | 1712 | 840 | 431 | 121 | 81 | 198 | 214 | 219 | 225 | 656.33 |
| 1957 | 185 | 386 | 327 | 202 | 157 | 93 | 78 | 71 | 121 | 132 | 165 | 171 | 174 |
| 1958 | 284 | 647 | 839 | 959 | 386 | 177 | 131 | 64 | 115 | 180 | 189 | 714 | 390.42 |
| 1959 | 831 | 596 | 773 | 684 | 493 | 288 | 85 | 93 | 180 | 281 | 781 | 2594 | 639.92 |
| 1960 | 1608 | 3216 | 2126 | 909 | 547 | 298 | 137 | 81 | 128 | 805 | 2468 | 1498 | 1151.75 |
| 1961 | 1539 | 878 | 565 | 355 | 286 | 234 | 145 | 97 | 188 | 209 | 854 | 1803 | 596.08 |
| 1962 | 3466 | 659 | 1580 | 1360 | 435 | 188 | 119 | 115 | 104 | 144 | 126 | 145 | 703.42 |
| 1963 | 1377 | 1436 | 1573 | 1081 | 395 | 321 | 104 | 84 | 140 | 154 | 1630 | 1786 | 840.08 |
| 1964 | 648 | 1644 | 2270 | 941 | 321 | 302 | 154 | 91 | 140 | 133 | 139 | 134 | 576.42 |
| 1965 | 187 | 316 | 781 | 412 | 164 | 62 | 66 | 61 | 79 | 252 | 831 | 1235 | 370.5 |
| 1966 | 2496 | 4684 | 1224 | 1540 | 450 | 301 | 133 | 147 | 110 | 276 | 756 | 449 | 1047.17 |
| 1967 | 468 | 626 | 715 | 326 | 466 | 209 | 137 | 145 | 167 | 112 | 221 | 262 | 321.17 |
| 1968 | 205 | 726 | 572 | 774 | 633 | 194 | 117 | 93 | 127 | 162 | 341 | 587 | 377.58 |
| |
|
|
|
|
|
|
|
|
|
|
|
|
|
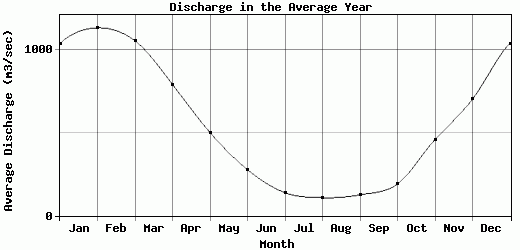
| Avg | 1039.67 | 1133.92 | 1055.86 | 792.14 | 501.89 | 277.72 | 138.92 | 108.61 | 126.11 | 191.31 | 458.83 | 703.58 | 544.05 |
| |
|
|
|
|
|
|
|
|
|
|
|
|
|
| Std Dev | 902.09 |
1048.8 |
704.66 |
557.4 |
306.92 |
155.05 |
48.52 |
35.08 |
38.71 |
127.11 |
480.36 |
581.4 |
274.29 |
| |
|
|
|
|
|
|
|
|
|
|
|
|
|
| | Jan | Feb | Mar | Apr | May | Jun | Jul | Aug | Sep | Oct | Nov | Dec | Avg Annual |
Click here for this table in tab-delimited format.
Tab-delimited format will open in most table browsing software, i.e. Excel, etc.
View this station on the map.
Return to start.