Results
| Country: | Yugoslavia
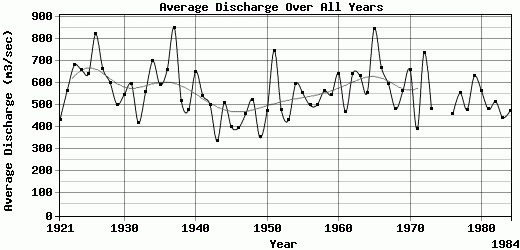
| | Station: | DonjiMiholjac | | River: | Drava | | Area: | 37142 km2 | | Lat: | 45.78 | | Lon: | 18.2 | | Source: | RivDIS | | PointID: | 755 | | Area Units: | km2 | | Discharge Units: | m3/sec | | Starting Year: | 1921 | | Ending Year: | 1984 | | Total Years: | 64 | | Total Usable Years: | 62 | |
| |
| Year | Jan | Feb | Mar | Apr | May | Jun | Jul | Aug | Sep | Oct | Nov | Dec | Avg Annual |
|---|
| 1921 | 440 | 383 | 314 | 459 | 906 | 621 | 484 | 429 | 335 | 276 | 272 | 261 | 431.67 |
| 1922 | 294 | 588 | 418 | 635 | 948 | 687 | 511 | 393 | 507 | 788 | 633 | 359 | 563.42 |
| 1923 | 387 | 402 | 724 | 685 | 979 | 845 | 822 | 561 | 524 | 642 | 653 | 925 | 679.08 |
| 1924 | 489 | 338 | 548 | 664 | 1039 | 1155 | 755 | 799 | 843 | 569 | 364 | 346 | 659.08 |
| 1925 | 238 | 314 | 402 | 435 | 1220 | 884 | 612 | 767 | 702 | 519 | 946 | 666 | 642.08 |
| 1926 | 388 | 516 | 402 | 624 | 838 | 982 | 1543 | 1164 | 505 | 703 | 1314 | 855 | 819.5 |
| 1927 | 533 | 373 | 505 | 808 | 916 | 836 | 689 | 687 | 736 | 623 | 632 | 625 | 663.58 |
| 1928 | 549 | 387 | 396 | 666 | 1035 | 784 | 600 | 531 | 531 | 520 | 796 | 427 | 601.83 |
| 1929 | 438 | 412 | 663 | 533 | 679 | 749 | 535 | 474 | 332 | 308 | 540 | 356 | 501.58 |
| 1930 | 322 | 349 | 406 | 490 | 594 | 754 | 520 | 659 | 503 | 734 | 726 | 511 | 547.33 |
| 1931 | 430 | 436 | 801 | 596 | 832 | 871 | 641 | 574 | 604 | 402 | 546 | 396 | 594.08 |
| 1932 | 390 | 309 | 390 | 594 | 622 | 581 | 482 | 355 | 279 | 365 | 318 | 345 | 419.17 |
| 1933 | 253 | 337 | 390 | 360 | 545 | 723 | 659 | 554 | 523 | 778 | 958 | 632 | 559.33 |
| 1934 | 532 | 347 | 690 | 830 | 1097 | 895 | 687 | 573 | 806 | 538 | 829 | 555 | 698.25 |
| 1935 | 597 | 477 | 453 | 579 | 847 | 1228 | 646 | 376 | 325 | 594 | 579 | 396 | 591.42 |
| 1936 | 660 | 585 | 577 | 708 | 1103 | 1142 | 895 | 619 | 411 | 449 | 437 | 302 | 657.33 |
| 1937 | 245 | 444 | 602 | 1092 | 1087 | 1160 | 713 | 935 | 1161 | 1101 | 834 | 811 | 848.75 |
| 1938 | 556 | 346 | 388 | 357 | 821 | 902 | 645 | 638 | 566 | 343 | 315 | 323 | 516.67 |
| 1939 | 420 | 299 | 244 | 307 | 612 | 1036 | 587 | 444 | 390 | 438 | 554 | 394 | 477.08 |
| 1940 | 449 | 433 | 694 | 451 | 692 | 671 | 572 | 665 | 610 | 974 | 1034 | 570 | 651.25 |
| 1941 | 606 | 486 | 582 | 615 | 658 | 793 | 561 | 641 | 468 | 285 | 500 | 319 | 542.83 |
| 1942 | 327 | 419 | 836 | 662 | 887 | 689 | 541 | 457 | 309 | 346 | 320 | 225 | 501.5 |
| 1943 | 241 | 303 | 194 | 234 | 356 | 558 | 543 | 379 | 300 | 338 | 281 | 319 | 337.17 |
| 1944 | 234 | 248 | 460 | 369 | 662 | 1009 | 731 | 444 | 391 | 372 | 622 | 547 | 507.42 |
| 1945 | 347 | 366 | 314 | 394 | 593 | 549 | 485 | 493 | 359 | 329 | 292 | 289 | 400.83 |
| 1946 | 260 | 304 | 286 | 394 | 384 | 643 | 817 | 444 | 353 | 258 | 262 | 352 | 396.42 |
| 1947 | 335 | 384 | 997 | 709 | 694 | 550 | 523 | 365 | 243 | 214 | 198 | 294 | 458.83 |
| 1948 | 292 | 352 | 359 | 432 | 614 | 752 | 1103 | 770 | 505 | 383 | 462 | 273 | 524.75 |
| 1949 | 307 | 207 | 204 | 293 | 450 | 487 | 392 | 442 | 356 | 258 | 366 | 478 | 353.33 |
| 1950 | 304 | 608 | 396 | 440 | 735 | 623 | 421 | 369 | 308 | 280 | 558 | 652 | 474.5 |
| 1951 | 425 | 650 | 749 | 853 | 1321 | 1753 | 955 | 544 | 351 | 333 | 609 | 404 | 745.58 |
| 1952 | 320 | 290 | 512 | 672 | 546 | 539 | 409 | 387 | 499 | 516 | 586 | 433 | 475.75 |
| 1953 | 398 | 273 | 250 | 331 | 463 | 674 | 616 | 698 | 407 | 390 | 457 | 232 | 432.42 |
| 1954 | 280 | 295 | 419 | 402 | 945 | 1311 | 1124 | 568 | 455 | 426 | 458 | 465 | 595.67 |
| 1955 | 308 | 309 | 583 | 622 | 781 | 820 | 697 | 497 | 442 | 602 | 624 | 347 | 552.67 |
| 1956 | 299 | 278 | 435 | 451 | 798 | 1170 | 750 | 491 | 347 | 282 | 383 | 298 | 498.5 |
| 1957 | 236 | 469 | 331 | 535 | 609 | 849 | 797 | 662 | 475 | 364 | 359 | 315 | 500.08 |
| 1958 | 299 | 398 | 454 | 567 | 777 | 591 | 591 | 683 | 489 | 605 | 732 | 581 | 563.92 |
| 1959 | 458 | 286 | 319 | 576 | 651 | 1034 | 920 | 758 | 380 | 259 | 406 | 513 | 546.67 |
| 1960 | 428 | 410 | 463 | 578 | 686 | 603 | 690 | 567 | 737 | 851 | 849 | 849 | 642.58 |
| 1961 | 493 | 380 | 407 | 485 | 558 | 734 | 551 | 405 | 278 | 359 | 546 | 424 | 468.33 |
| 1962 | 505 | 341 | 466 | 664 | 966 | 1140 | 966 | 697 | 486 | 303 | 715 | 458 | 642.25 |
| 1963 | 466 | 602 | 855 | 705 | 720 | 797 | 596 | 447 | 807 | 471 | 537 | 578 | 631.75 |
| 1964 | 590 | 538 | 435 | 642 | 562 | 586 | 495 | 350 | 296 | 746 | 829 | 574 | 553.58 |
| 1965 | 500 | 409 | 448 | 738 | 1093 | 1575 | 1285 | 1184 | 1066 | 692 | 456 | 690 | 844.67 |
| 1966 | 500 | 581 | 431 | 468 | 635 | 608 | 719 | 1202 | 817 | 479 | 898 | 700 | 669.83 |
| 1967 | 472 | 460 | 475 | 797 | 828 | 910 | 689 | 506 | 718 | 453 | 475 | 333 | 593 |
| 1968 | 299 | 325 | 316 | 528 | 551 | 770 | 603 | 576 | 557 | 417 | 473 | 365 | 481.67 |
| 1969 | 573 | 470 | 694 | 558 | 823 | 774 | 602 | 587 | 585 | 368 | 386 | 336 | 563 |
| 1970 | 502 | 544 | 658 | 830 | 959 | 850 | 851 | 922 | 618 | 429 | 426 | 334 | 660.25 |
| 1971 | 519 | 361 | 357 | 501 | 600 | 473 | 426 | 369 | 305 | 249 | 247 | 274 | 390.08 |
| 1972 | 300 | 356 | 451 | 873 | 991 | 1630 | 1700 | 893 | 509 | 331 | 455 | 362 | 737.58 |
| 1973 | 261 | 389 | 306 | 518 | 646 | 742 | 640 | 374 | 412 | 800 | 404 | 310 | 483.5 |
| 1974 | -9999 | -9999 | -9999 | -9999 | -9999 | -9999 | -9999 | -9999 | -9999 | -9999 | -9999 | -9999 | -9999 |
| 1975 | -9999 | -9999 | -9999 | -9999 | -9999 | -9999 | -9999 | -9999 | -9999 | -9999 | -9999 | -9999 | -9999 |
| 1976 | 291 | 264 | 315 | 422 | 631 | 539 | 374 | 368 | 453 | 707 | 569 | 558 | 457.58 |
| 1977 | 762 | 657 | 664 | 709 | 822 | 725 | 561 | 564 | 406 | 266 | 256 | 256 | 554 |
| 1978 | 227 | 264 | 416 | 491 | 712 | 893 | 819 | 573 | 378 | 482 | 262 | 232 | 479.08 |
| 1979 | 309 | 573 | 484 | 577 | 877 | 1020 | 979 | 635 | 454 | 435 | 666 | 544 | 629.42 |
| 1980 | 405 | 439 | 327 | 416 | 590 | 699 | 715 | 509 | 452 | 876 | 757 | 591 | 564.67 |
| 1981 | 389 | 345 | 496 | 482 | 542 | 763 | 657 | 497 | 392 | 467 | 373 | 356 | 479.92 |
| 1982 | 440 | 279 | 311 | 423 | 571 | 659 | 524 | 497 | 481 | 744 | 555 | 704 | 515.67 |
| 1983 | 521 | 426 | 504 | 535 | 621 | 620 | 484 | 335 | 405 | 333 | 254 | 279 | 443.08 |
| 1984 | 280 | 297 | 391 | 632 | 747 | 709 | 548 | 421 | 432 | 594 | 340 | 284 | 472.92 |
| |
|
|
|
|
|
|
|
|
|
|
|
|
|
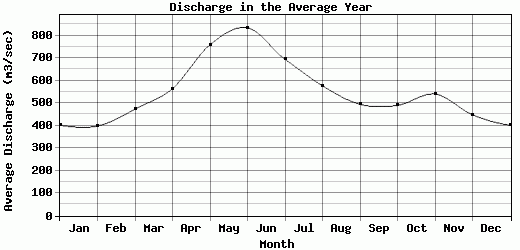
| Avg | 401.9 | 398.55 | 473.5 | 564.45 | 759.15 | 834.18 | 694.32 | 576.89 | 494.74 | 489.61 | 540.05 | 448.1 | 556.29 |
| |
|
|
|
|
|
|
|
|
|
|
|
|
|
| Std Dev | 121.91 |
107.12 |
166.54 |
161.67 |
204.76 |
268.67 |
249.11 |
199 |
183.73 |
199.24 |
224.59 |
170.63 |
111.63 |
| |
|
|
|
|
|
|
|
|
|
|
|
|
|
| | Jan | Feb | Mar | Apr | May | Jun | Jul | Aug | Sep | Oct | Nov | Dec | Avg Annual |
Click here for this table in tab-delimited format.
Tab-delimited format will open in most table browsing software, i.e. Excel, etc.
View this station on the map.
Return to start.