Results
| Country: | Spain
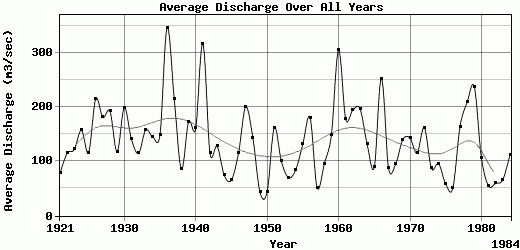
| | Station: | Villachica | | River: | Duero | | Area: | 41856 km2 | | Lat: | 41.5 | | Lon: | -5.48 | | Source: | RivDIS | | PointID: | 993 | | Area Units: | km2 | | Discharge Units: | m3/sec | | Starting Year: | 1921 | | Ending Year: | 1984 | | Total Years: | 64 | | Total Usable Years: | 64 | |
| |
| Year | Jan | Feb | Mar | Apr | May | Jun | Jul | Aug | Sep | Oct | Nov | Dec | Avg Annual |
|---|
| 1921 | 132 | 99 | 79 | 51 | 129 | 203 | 39 | 23 | 31 | 43 | 42 | 62 | 77.75 |
| 1922 | 128 | 281 | 165 | 289 | 126 | 61 | 18 | 12 | 21 | 46 | 148 | 83 | 114.83 |
| 1923 | 137 | 189 | 285 | 234 | 126 | 45 | 26 | 14 | 20 | 25 | 119 | 241 | 121.75 |
| 1924 | 197 | 258 | 501 | 432 | 174 | 50 | 16 | 14 | 29 | 28 | 49 | 139 | 157.25 |
| 1925 | 91 | 79 | 171 | 230 | 163 | 150 | 30 | 14 | 14 | 29 | 108 | 314 | 116.08 |
| 1926 | 206 | 633 | 280 | 367 | 233 | 114 | 46 | 23 | 26 | 38 | 310 | 301 | 214.75 |
| 1927 | 217 | 245 | 422 | 258 | 165 | 86 | 56 | 28 | 35 | 61 | 147 | 455 | 181.25 |
| 1928 | 344 | 227 | 342 | 362 | 383 | 221 | 69 | 41 | 44 | 68 | 106 | 95 | 191.83 |
| 1929 | 115 | 275 | 192 | 121 | 87 | 67 | 36 | 12 | 28 | 30 | 99 | 351 | 117.75 |
| 1930 | 257 | 336 | 375 | 293 | 321 | 330 | 128 | 44 | 37 | 57 | 55 | 153 | 198.83 |
| 1931 | 241 | 168 | 439 | 235 | 129 | 57 | 38 | 36 | 32 | 50 | 164 | 101 | 140.83 |
| 1932 | 108 | 67 | 96 | 110 | 142 | 100 | 78 | 54 | 47 | 70 | 113 | 392 | 114.75 |
| 1933 | 212 | 278 | 506 | 184 | 132 | 104 | 54 | 40 | 47 | 62 | 112 | 164 | 157.92 |
| 1934 | 209 | 127 | 132 | 334 | 269 | 128 | 44 | 45 | 42 | 46 | 58 | 300 | 144.5 |
| 1935 | 138 | 227 | 333 | 110 | 159 | 185 | 59 | 54 | 45 | 53 | 80 | 342 | 148.75 |
| 1936 | 803 | 896 | 529 | 595 | 504 | 256 | 177 | 82 | 55 | 72 | 92 | 89 | 345.83 |
| 1937 | 211 | 469 | 508 | 324 | 159 | 106 | 50 | 16 | 26 | 73 | 187 | 442 | 214.25 |
| 1938 | 287 | 158 | 126 | 60 | 59 | 22 | 10 | 7 | 25 | 34 | 17 | 223 | 85.67 |
| 1939 | 473 | 208 | 145 | 239 | 98 | 73 | 252 | 11 | 18 | 95 | 207 | 251 | 172.5 |
| 1940 | 287 | 543 | 156 | 150 | 229 | 107 | 51 | 29 | 30 | 77 | 136 | 132 | 160.58 |
| 1941 | 546 | 800 | 575 | 380 | 528 | 363 | 138 | 86 | 75 | 89 | 107 | 104 | 315.92 |
| 1942 | 130 | 134 | 179 | 185 | 182 | 81 | 49 | 41 | 61 | 84 | 116 | 137 | 114.92 |
| 1943 | 302 | 213 | 158 | 172 | 155 | 47 | 42 | 32 | 49 | 80 | 117 | 164 | 127.58 |
| 1944 | 113 | 82 | 117 | 147 | 83 | 52 | 31 | 18 | 42 | 40 | 58 | 106 | 74.08 |
| 1945 | 110 | 207 | 92 | 62 | 27 | 18 | 18 | 17 | 17 | 20 | 54 | 147 | 65.75 |
| 1946 | 107 | 84 | 115 | 247 | 415 | 145 | 35 | 31 | 18 | 44 | 52 | 93 | 115.5 |
| 1947 | 106 | 470 | 704 | 385 | 203 | 105 | 57 | 47 | 79 | 77 | 72 | 94 | 199.92 |
| 1948 | 449 | 405 | 169 | 130 | 174 | 93 | 39 | 45 | 37 | 50 | 56 | 75 | 143.5 |
| 1949 | 75 | 61 | 59 | 48 | 33 | 30 | 14 | 5 | 24 | 47 | 51 | 70 | 43.08 |
| 1950 | 54 | 75 | 67 | 48 | 50 | 77 | 19 | 10 | 10 | 24 | 30 | 57 | 43.42 |
| 1951 | 106 | 424 | 502 | 181 | 127 | 96 | 39 | 22 | 33 | 54 | 229 | 129 | 161.83 |
| 1952 | 109 | 133 | 104 | 299 | 142 | 55 | 58 | 27 | 50 | 44 | 54 | 123 | 99.83 |
| 1953 | 109 | 135 | 138 | 126 | 78 | 32 | 21 | 8 | 12 | 40 | 49 | 91 | 69.92 |
| 1954 | 88 | 192 | 198 | 112 | 137 | 75 | 15 | 18 | 18 | 37 | 50 | 74 | 84.5 |
| 1955 | 221 | 303 | 231 | 172 | 88 | 48 | 22 | 29 | 41 | 43 | 124 | 259 | 131.75 |
| 1956 | 302 | 180 | 488 | 547 | 252 | 122 | 46 | 32 | 44 | 54 | 56 | 46 | 180.75 |
| 1957 | 50 | 122 | 98 | 63 | 71 | 57 | 18 | 10 | 17 | 26 | 40 | 44 | 51.33 |
| 1958 | 82 | 183 | 182 | 231 | 85 | 51 | 40 | 11 | 25 | 49 | 37 | 164 | 95 |
| 1959 | 210 | 105 | 125 | 122 | 119 | 64 | 28 | 23 | 69 | 93 | 131 | 693 | 148.5 |
| 1960 | 505 | 746 | 551 | 256 | 143 | 111 | 40 | 48 | 47 | 200 | 558 | 448 | 304.42 |
| 1961 | 572 | 311 | 173 | 83 | 57 | 64 | 36 | 28 | 37 | 58 | 260 | 455 | 177.83 |
| 1962 | 745 | 233 | 480 | 373 | 148 | 87 | 40 | 27 | 34 | 52 | 51 | 61 | 194.25 |
| 1963 | 402 | 272 | 312 | 349 | 130 | 98 | 49 | 31 | 79 | 63 | 223 | 356 | 197 |
| 1964 | 136 | 308 | 436 | 321 | 94 | 72 | 33 | 23 | 27 | 50 | 39 | 38 | 131.42 |
| 1965 | 67 | 101 | 209 | 96 | 20 | 8 | 7 | 3 | 8 | 69 | 198 | 279 | 88.75 |
| 1966 | 622 | 836 | 384 | 330 | 140 | 104 | 38 | 25 | 24 | 100 | 269 | 150 | 251.83 |
| 1967 | 132 | 147 | 158 | 103 | 117 | 45 | 16 | 14 | 23 | 37 | 136 | 119 | 87.25 |
| 1968 | 107 | 187 | 141 | 225 | 189 | 51 | 22 | 22 | 33 | 32 | 49 | 81 | 94.92 |
| 1969 | 139 | 129 | 444 | 214 | 224 | 161 | 53 | 34 | 77 | 63 | 63 | 80 | 140.08 |
| 1970 | 728 | 304 | 169 | 99 | 94 | 70 | 28 | 34 | 42 | 53 | 47 | 48 | 143 |
| 1971 | 81 | 80 | 64 | 134 | 345 | 253 | 136 | 64 | 53 | 61 | 58 | 54 | 115.25 |
| 1972 | 98 | 465 | 331 | 192 | 161 | 92 | 41 | 44 | 70 | 94 | 127 | 229 | 162 |
| 1973 | 200 | 147 | 100 | 74 | 156 | 94 | 34 | 36 | 32 | 52 | 65 | 54 | 87 |
| 1974 | 181 | 213 | 225 | 175 | 81 | 49 | 53 | 21 | 24 | 36 | 48 | 44 | 95.83 |
| 1975 | 71 | 93 | 89 | 121 | 80 | 72 | 21 | 22 | 28 | 28 | 32 | 40 | 58.08 |
| 1976 | 39 | 66.5 | 58 | 60 | 39.5 | 22 | 23 | 15 | 28 | 43.5 | 98.5 | 112 | 50.42 |
| 1977 | 289 | 536 | 249 | 130 | 71.5 | 197 | 62 | 58.5 | 43 | 74.5 | 55.5 | 196 | 163.5 |
| 1978 | 268 | 681 | 590 | 204 | 276 | 116 | 53.5 | 50 | 45 | 46.5 | 46.5 | 126 | 208.54 |
| 1979 | 398 | 1077 | 370 | 388 | 126 | 74 | 58 | 36 | 51.5 | 71 | 97.5 | 105 | 237.67 |
| 1980 | 170 | 160 | 155 | 194 | 214 | 125 | 35 | 23 | 29 | 56 | 58 | 61 | 106.67 |
| 1981 | 75 | 65 | 81 | 102 | 86 | 26 | 26 | 17 | 22 | 40 | 34 | 84 | 54.83 |
| 1982 | 169 | 74 | 74 | 49 | 22 | 39 | 8 | 19 | 22 | 37 | 73 | 129 | 59.58 |
| 1983 | 79 | 74 | 80 | 109 | 182 | 45 | 29 | 31 | 28 | 26 | 36 | 75 | 66.17 |
| 1984 | 92 | 98 | 105 | 238 | 133 | 140 | 24 | 19 | 16 | 50 | 253 | 178 | 112.17 |
| |
|
|
|
|
|
|
|
|
|
|
|
|
|
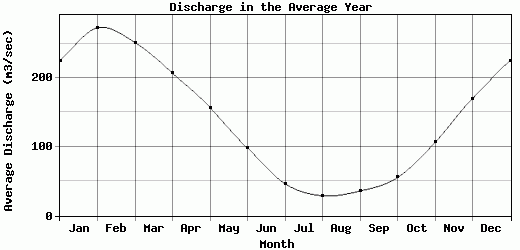
| Avg | 225.42 | 273.04 | 251.73 | 207.09 | 157.27 | 98.3 | 46.43 | 28.99 | 35.87 | 55.38 | 106.36 | 170.34 | 138.02 |
| |
|
|
|
|
|
|
|
|
|
|
|
|
|
| Std Dev | 179.57 |
226.93 |
167.74 |
122.47 |
104.04 |
70.01 |
40.23 |
17.08 |
17.2 |
26.58 |
87.78 |
133.01 |
64.97 |
| |
|
|
|
|
|
|
|
|
|
|
|
|
|
| | Jan | Feb | Mar | Apr | May | Jun | Jul | Aug | Sep | Oct | Nov | Dec | Avg Annual |
Click here for this table in tab-delimited format.
Tab-delimited format will open in most table browsing software, i.e. Excel, etc.
View this station on the map.
Return to start.