Results
| Country: | U.S.A.
| | Station: | Scotia,California | | River: | Eel | | Area: | 8063 km2 | | Lat: | 40.5 | | Lon: | -124.1 | | Source: | RivDIS | | PointID: | 344 | | Area Units: | km2 | | Discharge Units: | m3/sec | | Starting Year: | 1965 | | Ending Year: | 1984 | | Total Years: | 20 | | Total Usable Years: | 20 | |
| |
| Year | Jan | Feb | Mar | Apr | May | Jun | Jul | Aug | Sep | Oct | Nov | Dec | Avg Annual |
|---|
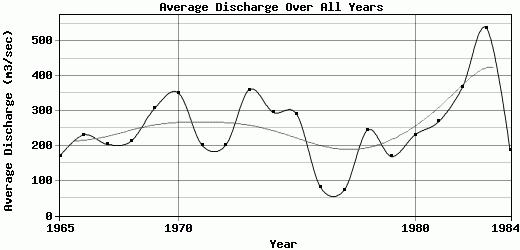
| 1965 | 993 | 175 | 86 | 344 | 83 | 25 | 9 | 5 | 4 | 4 | 136 | 186 | 170.83 |
| 1966 | 959 | 349 | 427 | 183 | 56 | 16 | 7 | 4 | 3 | 3 | 219 | 554 | 231.67 |
| 1967 | 785 | 286 | 452 | 414 | 207 | 56 | 14 | 5 | 4 | 10 | 17 | 201 | 204.25 |
| 1968 | 524 | 708 | 302 | 75 | 33 | 15 | 5.3 | 6.7 | 5.3 | 7.2 | 51 | 821 | 212.79 |
| 1969 | 1450 | 847 | 362 | 214 | 125 | 34.5 | 9.9 | 4.3 | 3.7 | 9 | 19 | 607 | 307.12 |
| 1970 | 1938 | 423 | 250 | 55 | 33.5 | 13.5 | 5.7 | 2.7 | 2.2 | 6.7 | 420 | 1070 | 351.69 |
| 1971 | 903 | 124 | 672 | 218 | 90 | 32 | 10.5 | 5.6 | 4.7 | 5.9 | 60 | 291 | 201.39 |
| 1972 | 395 | 535 | 496 | 221 | 57 | 21 | 7.2 | 3.7 | 6.2 | 22 | 143 | 511 | 201.51 |
| 1973 | 957 | 584 | 374 | 174 | 62 | 17.5 | 6.46 | 3.74 | 8.61 | 55 | 1100 | 991 | 361.11 |
| 1974 | 1290 | 391 | 1030 | 556 | 80 | 28.5 | 13 | 5.47 | 3.57 | 3.96 | 17 | 133 | 295.96 |
| 1975 | 238 | 1130 | 1280 | 274 | 165 | 43.5 | 12.5 | 5.81 | 4.3 | 57.5 | 101 | 167 | 289.88 |
| 1976 | 75 | 380 | 260 | 174 | 44 | 16 | 5.6 | 6.1 | 3.5 | 3.1 | 7.3 | 4.7 | 81.61 |
| 1977 | 18 | 27 | 70 | 24 | 17 | 7.1 | 1.9 | 0.8 | 5.3 | 11 | 131 | 558 | 72.59 |
| 1978 | 1260 | 692 | 465 | 340 | 107 | 32 | 11 | 4.5 | 10 | 4.4 | 6.5 | 12 | 245.37 |
| 1979 | 187 | 480 | 367 | 143 | 180 | 25 | 9.4 | 4 | 3.8 | 70 | 335 | 229 | 169.43 |
| 1980 | 979 | 819 | 469 | 202 | 65.5 | 26.5 | 11 | 5.6 | 3.2 | 5.4 | 8 | 187 | 231.77 |
| 1981 | 371 | 407 | 316 | 119 | 44 | 16 | 6.2 | 2.8 | 3.4 | 37 | 740 | 1172 | 269.53 |
| 1982 | 542 | 752 | 446 | 1109 | 119 | 30.5 | 13 | 5.1 | 4.4 | 28.5 | 298 | 1070 | 368.13 |
| 1983 | 833 | 1331 | 1448 | 526 | 268 | 72 | 22.5 | 12 | 14.5 | 7.4 | 633 | 1284 | 537.62 |
| 1984 | 226 | 360 | 332 | 187 | 78 | 27.5 | 9.4 | 4.8 | 3.5 | 13 | 756 | 272 | 189.1 |
| |
|
|
|
|
|
|
|
|
|
|
|
|
|
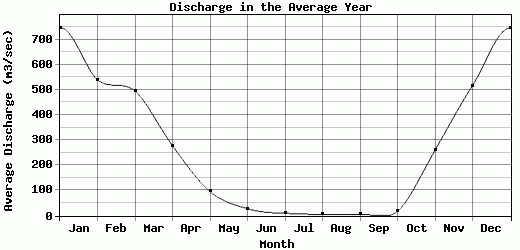
| Avg | 746.15 | 540 | 495.2 | 277.6 | 95.7 | 27.76 | 9.53 | 4.89 | 5.06 | 18.2 | 259.89 | 516.04 | 249.67 |
| |
|
|
|
|
|
|
|
|
|
|
|
|
|
| Std Dev | 494.54 |
318.57 |
350.73 |
235.66 |
63.53 |
14.95 |
4.27 |
2.1 |
2.83 |
20.03 |
306.43 |
403.55 |
102.93 |
| |
|
|
|
|
|
|
|
|
|
|
|
|
|
| | Jan | Feb | Mar | Apr | May | Jun | Jul | Aug | Sep | Oct | Nov | Dec | Avg Annual |
Click here for this table in tab-delimited format.
Tab-delimited format will open in most table browsing software, i.e. Excel, etc.
View this station on the map.
Return to start.