Results
| Country: | Senegal
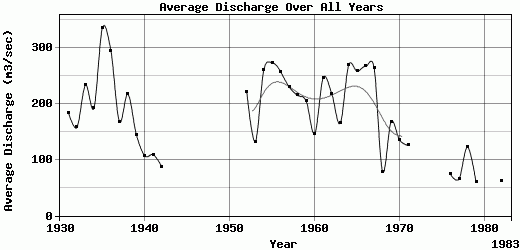
| | Station: | Kidira | | River: | Faleme | | Area: | 28900 km2 | | Lat: | 14.78 | | Lon: | -12.21 | | Source: | RivDIS | | PointID: | 1015 | | Area Units: | km2 | | Discharge Units: | m3/sec | | Starting Year: | 1930 | | Ending Year: | 1983 | | Total Years: | 54 | | Total Usable Years: | 45 | |
| |
| Year | Jan | Feb | Mar | Apr | May | Jun | Jul | Aug | Sep | Oct | Nov | Dec | Avg Annual |
|---|
| 1930 | -9999 | -9999 | -9999 | -9999 | 1 | 10 | 88 | 870 | 975 | 458 | 67 | 34 | -9999 |
| 1931 | 18 | 8 | 4 | 1 | 1 | 24 | 269 | 462 | 831 | 468 | 85 | 43 | 184.5 |
| 1932 | 22 | 10 | 5 | 2 | 1 | 11 | 253 | 616 | 570 | 320 | 59 | 28 | 158.08 |
| 1933 | 14 | 7 | 3 | 1 | 1 | 112 | 404 | 1259 | 722 | 202 | 55 | 26 | 233.83 |
| 1934 | 14 | 7 | 3 | 1 | 1 | 24 | 82 | 939 | 917 | 229 | 66 | 29 | 192.67 |
| 1935 | 13 | 7 | 3 | 1 | 1 | 24 | 255 | 1423 | 1491 | 636 | 127 | 55 | 336.33 |
| 1936 | 27 | 14 | 6 | 2 | 1 | 38 | 101 | 1078 | 1480 | 542 | 196 | 52 | 294.75 |
| 1937 | 23 | 12 | 6 | 2 | 1 | 24 | 114 | 453 | 950 | 261 | 136 | 37 | 168.25 |
| 1938 | 17 | 9 | 4 | 1 | 1 | 24 | 103 | 417 | 1107 | 482 | 375 | 69 | 217.42 |
| 1939 | 29 | 15 | 7 | 2 | 1 | 24 | 86 | 637 | 526 | 325 | 59 | 28 | 144.92 |
| 1940 | 14 | 7 | 3 | 1 | 1 | 24 | 90 | 341 | 218 | 401 | 147 | 38 | 107.08 |
| 1941 | 18 | 9 | 4 | 1 | 1 | 24 | 116 | 328 | 583 | 169 | 39 | 19 | 109.25 |
| 1942 | 8 | 5 | 2 | 1 | 1 | 24 | 50 | 528 | 332 | 64 | 25 | 13 | 87.75 |
| 1943 | 6 | 4 | 2 | 1 | -9999 | -9999 | -9999 | -9999 | -9999 | -9999 | -9999 | -9999 | -9999 |
| 1944 | -9999 | -9999 | -9999 | -9999 | 1 | 24 | 50 | 153 | 338 | 136 | 57 | 23 | -9999 |
| 1945 | 11 | 6 | 2 | 1 | -9999 | -9999 | -9999 | -9999 | -9999 | -9999 | -9999 | -9999 | -9999 |
| 1946 | -9999 | -9999 | -9999 | -9999 | 1 | 24 | 100 | 738 | 831 | 402 | 59 | 27 | -9999 |
| 1947 | 13 | 7 | 3 | 1 | -9999 | -9999 | -9999 | -9999 | -9999 | -9999 | -9999 | -9999 | -9999 |
| 1948 | -9999 | -9999 | -9999 | -9999 | -9999 | -9999 | -9999 | -9999 | -9999 | -9999 | -9999 | -9999 | -9999 |
| 1949 | -9999 | -9999 | -9999 | -9999 | -9999 | -9999 | -9999 | -9999 | -9999 | -9999 | -9999 | -9999 | -9999 |
| 1950 | -9999 | -9999 | -9999 | -9999 | -9999 | -9999 | -9999 | -9999 | -9999 | -9999 | -9999 | -9999 | -9999 |
| 1951 | -9999 | -9999 | -9999 | -9999 | 0.3 | 5.8 | 64 | 327 | 693 | 1341 | 301 | 76 | -9999 |
| 1952 | 34 | 14.6 | 6.9 | 2.2 | 0.7 | 0.2 | 133 | 401 | 792 | 1096 | 132 | 49 | 221.8 |
| 1953 | 23.1 | 9 | 4.6 | 1.6 | 0.4 | 9.7 | 144 | 357 | 725 | 214 | 70 | 28 | 132.2 |
| 1954 | 13.5 | 8.3 | 3.6 | 1.4 | 0.3 | 60 | 253 | 1123 | 1189 | 289 | 126 | 60 | 260.59 |
| 1955 | 29 | 13.6 | 7.2 | 3 | 0.8 | 43 | 180 | 1222 | 1032 | 572 | 126 | 55 | 273.63 |
| 1956 | 28 | 13.8 | 7.4 | 3.5 | 1.3 | 10.6 | 137 | 601 | 1780 | 368 | 97 | 43 | 257.55 |
| 1957 | 20 | 9 | 4.6 | 2 | 0.9 | 49 | 122 | 735 | 1141 | 500 | 129 | 52 | 230.38 |
| 1958 | 23.8 | 10.7 | 4.9 | 2.2 | 1.2 | 33 | 131 | 990 | 795 | 370 | 143 | 80 | 215.4 |
| 1959 | 29 | 12.9 | 7.8 | 3 | 1.2 | 13.8 | 73 | 855 | 1118 | 242 | 71 | 34 | 205.06 |
| 1960 | 16.2 | 8.1 | 4.1 | 1.9 | 1.1 | 7.1 | 191 | 551 | 625 | 250 | 70 | 30 | 146.29 |
| 1961 | 14.8 | 8.1 | 3.8 | 1.8 | 0.5 | 35 | 188 | 706 | 1709 | 209 | 61 | 25 | 246.83 |
| 1962 | 11.2 | 6.1 | 2.6 | 0.9 | 0.2 | 22.4 | 122 | 746 | 1245 | 324 | 110 | 35 | 218.78 |
| 1963 | 16.9 | 7.9 | 3.9 | 1.7 | 0.4 | 0.9 | 170 | 524 | 746 | 395 | 83 | 31 | 165.06 |
| 1964 | 13.8 | 6.3 | 2.8 | 0.8 | 0.1 | 41 | 180 | 714 | 1805 | 329 | 93 | 44 | 269.15 |
| 1965 | 19.6 | 9.9 | 5 | 2.1 | 0.3 | 22.9 | 109 | 1078 | 1265 | 422 | 124 | 45.8 | 258.63 |
| 1966 | 23.4 | 11.6 | 5.7 | 3.2 | 1.5 | 6.4 | 78.6 | 483 | 864 | 1523 | 153 | 55.6 | 267.42 |
| 1967 | 24.9 | 12 | 5.7 | 3.2 | 0.7 | 48.2 | 150 | 501 | 1485 | 742 | 139 | 60.5 | 264.35 |
| 1968 | 30.3 | 15.5 | 6.8 | 3.2 | 1.5 | 2.7 | 70.4 | 161 | 381 | 200 | 48.6 | 22.1 | 78.59 |
| 1969 | 6.7 | 3.4 | 0.8 | 0 | 0 | 13.7 | 148 | 491 | 664 | 483 | 164 | 43.2 | 168.15 |
| 1970 | 19.9 | 9.9 | 5.4 | 1.6 | 0.5 | 0.2 | 116 | 742 | 568 | 106 | 40.8 | 14.2 | 135.38 |
| 1971 | 10 | 4.7 | 1.6 | 0.1 | 0 | 6.8 | 81.1 | 525 | 682 | 142 | 39.1 | 14.9 | 125.61 |
| 1972 | 7.6 | 3.8 | 1 | 0.1 | 0 | 3.8 | 40.3 | 193 | 169 | -9999 | -9999 | -9999 | -9999 |
| 1973 | -9999 | -9999 | -9999 | -9999 | -9999 | -9999 | 40.2 | 458 | 314 | 78.4 | 13.4 | 7.4 | -9999 |
| 1974 | -9999 | -9999 | -9999 | -9999 | 0 | 0 | 222 | 899 | 589 | 226 | 43.4 | 13.9 | -9999 |
| 1975 | 7.1 | 3.6 | 1.4 | 0.2 | -9999 | -9999 | -9999 | -9999 | -9999 | -9999 | -9999 | -9999 | -9999 |
| 1976 | 9.1 | 4.4 | 0.98 | 0.01 | 0 | 2.6 | 110 | 258 | 174 | 184 | 120 | 23.5 | 73.88 |
| 1977 | 3.8 | 1 | 0.01 | 0 | 0 | 0.38 | 23.5 | 125 | 410 | 184 | 31 | 9.2 | 65.66 |
| 1978 | 9.8 | 3.9 | 0.5 | 0 | 0 | 0 | 34.5 | 590 | 431 | 292 | 95.5 | 20.5 | 123.14 |
| 1979 | 3.7 | 0.56 | 0 | 0 | 0 | 1.4 | 50 | 187 | 312 | 121 | 34.5 | 10.5 | 60.06 |
| 1980 | 3.66 | 0.56 | 0 | 0 | -9999 | -9999 | -9999 | -9999 | -9999 | -9999 | -9999 | -9999 | -9999 |
| 1981 | -9999 | -9999 | -9999 | -9999 | 0 | 0 | 71.9 | 468 | 477 | 97.8 | 24.3 | 8.93 | -9999 |
| 1982 | 2.69 | 0.36 | 0.01 | 0 | 0 | 0 | 33.5 | 255 | 281 | 131 | 28.4 | 9.47 | 61.79 |
| 1983 | 2.71 | 0.24 | 0 | 0 | -9999 | -9999 | -9999 | -9999 | -9999 | -9999 | -9999 | -9999 | -9999 |
| |
|
|
|
|
|
|
|
|
|
|
|
|
|
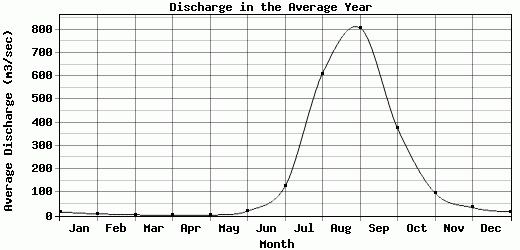
| Avg | 16.03 | 7.75 | 3.55 | 1.33 | 0.66 | 19.9 | 125.07 | 611.29 | 807.38 | 375.6 | 96.89 | 34.61 | 182.71 |
| |
|
|
|
|
|
|
|
|
|
|
|
|
|
| Std Dev | 8.4 |
4.15 |
2.26 |
1.02 |
0.47 |
20.84 |
75.81 |
315.98 |
433.15 |
301.96 |
68.98 |
18.49 |
73.47 |
| |
|
|
|
|
|
|
|
|
|
|
|
|
|
| | Jan | Feb | Mar | Apr | May | Jun | Jul | Aug | Sep | Oct | Nov | Dec | Avg Annual |
Click here for this table in tab-delimited format.
Tab-delimited format will open in most table browsing software, i.e. Excel, etc.
View this station on the map.
Return to start.