Results
| Country: | U.S.A.
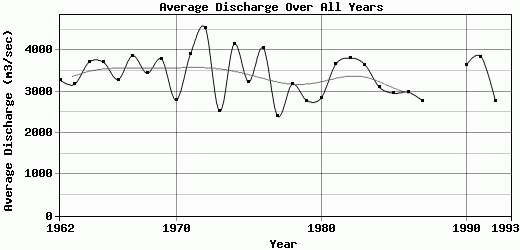
| | Station: | LITTLE RAPIDS, WI | | River: | FOX RIVER | | Area: | 10437609.68 | | Lat: | 44.37 | | Lon: | -88.12 | | Source: | USGS | | PointID: | 4085054 | | Area Units: | km2 | | Discharge Units: | m3/sec | | Starting Year: | 1962 | | Ending Year: | 1993 | | Total Years: | 32 | | Total Usable Years: | 29 | |
| |
| Year | Jan | Feb | Mar | Apr | May | Jun | Jul | Aug | Sep | Oct | Nov | Dec | Avg Annual |
|---|
| 1962 | 1986.57 | 2181.62 | 1727.34 | 3220.59 | 5266.96 | 7753.19 | 5563.83 | 3496.33 | 1959.73 | 1874.4 | 2031.74 | 2288.29 | 3279.22 |
| 1963 | 2376.71 | 2396.53 | 2162.6 | 2833.78 | 4329.58 | 7703.17 | 5752 | 3030.01 | 2008.71 | 1903.08 | 1790.01 | 1798.13 | 3173.69 |
| 1964 | 1707.79 | 2159.22 | 1867.28 | 1920.08 | 4739.35 | 10974.7 | 8416.54 | 3769.27 | 2337.95 | 2484.5 | 2101.59 | 2019.18 | 3708.12 |
| 1965 | 2255.95 | 2880.04 | 2489.89 | 3262.02 | 6839.01 | 8911.36 | 6144.79 | 3688.52 | 2175.5 | 1851.48 | 1962.37 | 2027.04 | 3707.33 |
| 1966 | 1976.53 | 2233.2 | 2139.4 | 2263.94 | 5384.8 | 7795.67 | 6480.94 | 3152.69 | 2215.9 | 1950.04 | 1844.76 | 2074.45 | 3292.69 |
| 1967 | 2158.49 | 2224 | 2563.69 | 2625.93 | 3956.07 | 12112.1 | 8062.12 | 3555.15 | 2361.54 | 2158.58 | 2163.42 | 2480.11 | 3868.43 |
| 1968 | 2250.84 | 2112.74 | 3222.93 | 2917.97 | 3688.61 | 7773.02 | 6468.15 | 3302.86 | 2592.52 | 2161.04 | 2264.89 | 2530.63 | 3440.52 |
| 1969 | 2895.92 | 3196.79 | 2978.77 | 5152.75 | 6627.09 | 6645.06 | 5306.24 | 2854.54 | 2094.51 | 2297.6 | 2627.35 | 2735.51 | 3784.34 |
| 1970 | 2516.83 | 2178.99 | 2399.55 | 2628.38 | 3747.71 | 5238.65 | 3421.24 | 2865.13 | 2166.53 | 2156.29 | 2018.44 | 2158.39 | 2791.34 |
| 1971 | 2082.21 | 2649.26 | 3763.15 | 3464.11 | 7630.97 | 8459.23 | 5887.2 | 3701.03 | 2082.53 | 2125.88 | 2372.11 | 2826.58 | 3920.35 |
| 1972 | 2643.53 | 3013.22 | 4297.79 | 4518.17 | 7032.66 | 11241.8 | 6886.51 | 4450.34 | 2781.96 | 2295.5 | 2392.13 | 2942.23 | 4541.32 |
| 1973 | 2659.88 | 2745.84 | 2808.32 | 2862.28 | 2261.71 | 2462.82 | 2990.18 | 2829.23 | 2075.35 | 2124.32 | 1839.85 | 2657.32 | 2526.42 |
| 1974 | 4055.36 | 4194.96 | 3389.91 | 4242.83 | 5596.72 | 7465.31 | 5988.59 | 3770.64 | 2957.43 | 2687.1 | 2632.63 | 2749.67 | 4144.26 |
| 1975 | 2891.99 | 3271.12 | 3808.18 | 3385.3 | 4567.26 | 4526 | 3352.92 | 2753.69 | 1941.7 | 2349.4 | 2909.95 | 3052.57 | 3234.17 |
| 1976 | 3354.56 | 4026.87 | 3984.48 | 3874.9 | 5484.36 | 4799.73 | 5398.5 | 5714.55 | 3473.93 | 2937.11 | 2788.37 | 2793.61 | 4052.58 |
| 1977 | 3160.18 | 2663.31 | 2675.04 | 2014.94 | 2702.99 | 2310.95 | 2167.53 | 2250.65 | 2293.96 | 1907.65 | 2372.96 | 2336.7 | 2404.74 |
| 1978 | 2968.17 | 2981.07 | 2714.87 | 3884.15 | 4261.25 | 3688.1 | 3463.44 | 2637.41 | 2996.03 | 2808.68 | 2942.42 | 2773.51 | 3176.59 |
| 1979 | 3457.41 | 3039.73 | 2670.57 | 2912.21 | 3582.37 | 2838.68 | 2572.46 | 2464.22 | 2111.88 | 2232.38 | 2815.37 | 2697.97 | 2782.94 |
| 1980 | 3045.08 | 2752.22 | 2372.87 | 2211.09 | 3657.92 | 4634.55 | 3160.45 | 2552.73 | 1970.67 | 1989.59 | 2469.62 | 3342.78 | 2846.63 |
| 1981 | 4315.15 | 3766.26 | 3045.27 | 2809.99 | 4170.82 | 6787.59 | 5182.01 | 3895.87 | 2304.91 | 2403.57 | 2456.5 | 2784.75 | 3660.22 |
| 1982 | 3303.68 | 3528.1 | 5236.82 | 4414.62 | 5155.52 | 5547.3 | 5073.31 | 3503.18 | 2363.05 | 2251.29 | 2812.35 | 2585.16 | 3814.53 |
| 1983 | 3182.1 | 4176.25 | 5666.14 | 4567.53 | 4738.99 | 4014.41 | 3926.93 | 3522.73 | 2284.43 | 2016.81 | 2487.55 | 3268.6 | 3654.37 |
| 1984 | 3103.36 | 3827.19 | 3099.16 | 3753.14 | 3843.99 | 4016.77 | 3530.31 | 2901.03 | 1984.64 | 2236.13 | 2168.52 | 2820.19 | 3107.04 |
| 1985 | 4059.47 | 3964.38 | 3112.13 | 2683.79 | 3742.68 | 2961.77 | 2200.69 | 1824.98 | 1835.7 | 2445.58 | 3159.33 | 3512.77 | 2958.61 |
| 1986 | 2308.84 | 2737.55 | 3415.3 | 4048.39 | 3795.76 | 3718.02 | 3292.99 | 2724.74 | 2084.89 | 2191 | 2624.23 | 2857.28 | 2983.25 |
| 1987 | 3460.34 | 2718.53 | 2239.51 | 2615.45 | 4190.92 | 3287.6 | 2372.14 | 2368.03 | 2181.64 | 2602.15 | 2299.06 | 2962.87 | 2774.85 |
| 1988 | -9999 | -9999 | -9999 | -9999 | -9999 | -9999 | -9999 | -9999 | -9999 | -9999 | -9999 | -9999 | -9999 |
| 1989 | -9999 | -9999 | -9999 | -9999 | -9999 | -9999 | -9999 | -9999 | -9999 | -9999 | -9999 | -9999 | -9999 |
| 1990 | 3398.31 | 3766.16 | 3835.77 | 3883.87 | 4040.2 | 5935.24 | 4129.99 | 3076.32 | 2033.82 | 2132.36 | 3339.14 | 4141.59 | 3642.73 |
| 1991 | 4203.16 | 4010.9 | 4604.71 | 4780.85 | 5014.85 | 5157.47 | 4384.57 | 3795.94 | 2302.08 | 2534.74 | 2707.58 | 2715.42 | 3851.02 |
| 1992 | 3072.39 | 2423.54 | 2928.62 | 2594.31 | 3717.75 | 4088.79 | 2517.2 | 2447.96 | 2056.85 | 1884.63 | 2370.04 | 3197.63 | 2774.98 |
| 1993 | -9999 | -9999 | -9999 | -9999 | -9999 | -9999 | -9999 | -9999 | -9999 | -9999 | -9999 | -9999 | -9999 |
| |
|
|
|
|
|
|
|
|
|
|
|
|
|
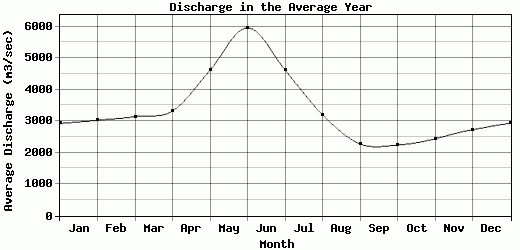
| Avg | 2925.89 | 3028.26 | 3145.52 | 3322.32 | 4612.72 | 5960.31 | 4623.92 | 3203.44 | 2276.91 | 2241.13 | 2440.15 | 2728.65 | 3375.77 |
| |
|
|
|
|
|
|
|
|
|
|
|
|
|
| Std Dev | 692.43 |
677.11 |
938.15 |
864.33 |
1233.51 |
2634.95 |
1724.84 |
755.25 |
360.33 |
279.55 |
390.5 |
485.64 |
520.69 |
| |
|
|
|
|
|
|
|
|
|
|
|
|
|
| | Jan | Feb | Mar | Apr | May | Jun | Jul | Aug | Sep | Oct | Nov | Dec | Avg Annual |
Click here for this table in tab-delimited format.
Tab-delimited format will open in most table browsing software, i.e. Excel, etc.
View this station on the map.
Return to start.