Results
| Country: | U.S.A.
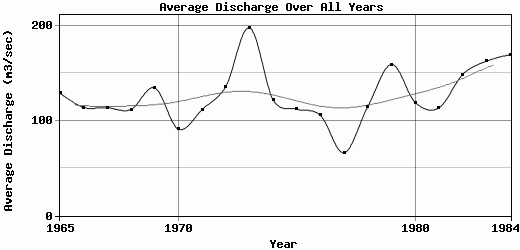
| | Station: | Wrightstown,Wis. | | River: | Fox | | Area: | 16084 km2 | | Lat: | 44.31 | | Lon: | -88.2 | | Source: | RivDIS | | PointID: | 393 | | Area Units: | km2 | | Discharge Units: | m3/sec | | Starting Year: | 1965 | | Ending Year: | 1984 | | Total Years: | 20 | | Total Usable Years: | 20 | |
| |
| Year | Jan | Feb | Mar | Apr | May | Jun | Jul | Aug | Sep | Oct | Nov | Dec | Avg Annual |
|---|
| 1965 | 58 | 100 | 181 | 195 | 197 | 104 | 53 | 47 | 84 | 167 | 152 | 208 | 128.83 |
| 1966 | 197 | 178 | 259 | 217 | 103 | 102 | 61 | 45 | 41 | 35 | 58 | 69 | 113.75 |
| 1967 | 81 | 120 | 87 | 274 | 110 | 163 | 123 | 57 | 46 | 51 | 139 | 113 | 113.67 |
| 1968 | 78.5 | 69 | 87.5 | 64.5 | 204 | 145 | 192 | 90.5 | 83 | 108 | 108 | 110 | 111.67 |
| 1969 | 135 | 158 | 127 | 253 | 171 | 133 | 312 | 63 | 41 | 49 | 83 | 88 | 134.42 |
| 1970 | 143 | 117 | 92 | 44.5 | 90 | 204 | 46 | 38 | 42 | 48 | 140 | 87 | 90.96 |
| 1971 | 94.5 | 116 | 194 | 226 | 134 | 122 | 61 | 55 | 46.5 | 51 | 116 | 122 | 111.5 |
| 1972 | 109 | 93 | 149 | 204 | 188 | 66.5 | 56 | 66 | 200 | 204 | 212 | 81 | 135.71 |
| 1973 | 195 | 220 | 352 | 370 | 436 | 263 | 89.5 | 65.5 | 63.5 | 77 | 115 | 124 | 197.54 |
| 1974 | 104 | 159 | 153 | 250 | 173 | 197 | 71.5 | 62 | 49 | 40.5 | 89.5 | 113 | 121.79 |
| 1975 | 84 | 92 | 124 | 175 | 248 | 157 | 57.5 | 52.5 | 95.5 | 65 | 60 | 132 | 111.88 |
| 1976 | 118 | 127 | 182 | 332 | 181 | 75 | 44 | 36 | 28 | 22 | 60 | 60 | 105.42 |
| 1977 | 40 | 50 | 55 | 110 | 70 | 55 | 47 | 39 | 35 | 70 | 114 | 107 | 66 |
| 1978 | 114 | 108 | 70 | 106 | 206 | 95 | 153 | 70 | 133 | 103 | 95 | 125 | 114.83 |
| 1979 | 112 | 119 | 210 | 457 | 329 | 155 | 65 | 80 | 122 | 50 | 105 | 105 | 159.08 |
| 1980 | 132 | 120 | 72 | 116 | 95.5 | 169 | 55.5 | 108 | 211 | 167 | 81.5 | 101 | 119.04 |
| 1981 | 106 | 136 | 163 | 193 | 119 | 64 | 56 | 58 | 83.5 | 185 | 92 | 104 | 113.29 |
| 1982 | 151 | 116 | 104 | 283 | 152 | 99 | 96 | 116 | 59.5 | 74.5 | 249 | 280 | 148.33 |
| 1983 | 177 | 141 | 288 | 194 | 214 | 164 | 72.5 | 59.5 | 143 | 168 | 144 | 185 | 162.5 |
| 1984 | 139 | 124 | 160 | 102 | 216 | 188 | 124 | 66 | 148 | 209 | 360 | 196 | 169.33 |
| |
|
|
|
|
|
|
|
|
|
|
|
|
|
| Avg | 118.4 | 123.15 | 155.48 | 208.3 | 181.83 | 136.03 | 91.78 | 63.7 | 87.73 | 97.2 | 128.65 | 125.5 | 126.48 |
| |
|
|
|
|
|
|
|
|
|
|
|
|
|
| Std Dev | 40.67 |
36.4 |
75.83 |
101.62 |
84.05 |
53.1 |
63.51 |
20.86 |
53.37 |
60.5 |
70.8 |
51.95 |
28.82 |
| |
|
|
|
|
|
|
|
|
|
|
|
|
|
| | Jan | Feb | Mar | Apr | May | Jun | Jul | Aug | Sep | Oct | Nov | Dec | Avg Annual |
Click here for this table in tab-delimited format.
Tab-delimited format will open in most table browsing software, i.e. Excel, etc.
View this station on the map.
Return to start.