Results
| Country: | Canada
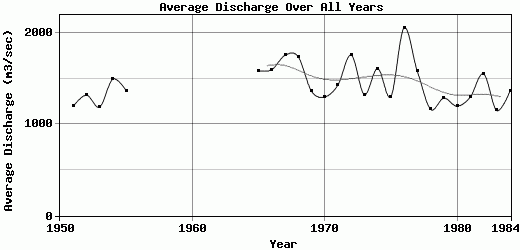
| | Station: | Marguerite | | River: | Fraser | | Area: | 114000 km2 | | Lat: | 52.53 | | Lon: | -122.45 | | Source: | RivDIS | | PointID: | 271 | | Area Units: | km2 | | Discharge Units: | m3/sec | | Starting Year: | 1950 | | Ending Year: | 1984 | | Total Years: | 35 | | Total Usable Years: | 33 | |
| |
| Year | Jan | Feb | Mar | Apr | May | Jun | Jul | Aug | Sep | Oct | Nov | Dec | Avg Annual |
|---|
| 1950 | -9999 | -9999 | -9999 | -9999 | 2790 | 4230 | 3140 | 1730 | 1130 | 889 | 872 | 500 | -9999 |
| 1951 | 377 | 337 | 313 | 719 | 3340 | 2860 | 2500 | 1360 | 770 | 710 | 614 | 472 | 1197.67 |
| 1952 | 330 | 270 | 263 | 1080 | 3070 | 3400 | 2920 | 1680 | 1160 | 920 | 516 | 218 | 1318.92 |
| 1953 | 245 | 257 | 258 | 512 | 2760 | 2720 | 2190 | 1420 | 1270 | 1060 | 1030 | 546 | 1189 |
| 1954 | 371 | 407 | 360 | 360 | 2250 | 3450 | 3130 | 2190 | 1620 | 1420 | 1490 | 863 | 1492.58 |
| 1955 | 549 | 450 | 366 | 801 | 2030 | 3900 | 3600 | 2160 | 974 | 715 | 484 | 375 | 1367 |
| 1956 | 305 | 293 | 282 | 950 | 2860 | 3500 | 2180 | 1320 | 955 | 903 | 713 | -9999 | -9999 |
| 1957 | -9999 | 505 | 481 | 868 | 4160 | 3030 | 2310 | 2000 | 1460 | 874 | 1140 | 970 | -9999 |
| 1958 | 811 | 664 | 715 | 1650 | 3430 | 3100 | 1960 | 1370 | 1410 | 1780 | 867 | -9999 | -9999 |
| 1959 | -9999 | -9999 | -9999 | 909 | 2770 | 3460 | 2910 | 1920 | 2340 | 1900 | 1510 | 995 | -9999 |
| 1960 | 622 | -9999 | -9999 | 1530 | 2690 | 3810 | 3630 | 2110 | 1850 | 1720 | 1120 | 683 | -9999 |
| 1961 | 591 | 490 | 509 | 1210 | 2940 | 3390 | 2010 | 1430 | 1580 | 1630 | 929 | -9999 | -9999 |
| 1962 | -9999 | -9999 | -9999 | 1660 | 2440 | 3620 | 3370 | 2640 | 1510 | 1590 | 1640 | 900 | -9999 |
| 1963 | 750 | 814 | 787 | 1430 | 2640 | 3510 | 2730 | 1900 | 1640 | 1350 | 793 | -9999 | -9999 |
| 1964 | -9999 | -9999 | -9999 | 836 | 2620 | 5030 | 3610 | 2860 | 1960 | 2050 | 1260 | 612 | -9999 |
| 1965 | 538 | 539 | 529 | 1400 | 3220 | 3910 | 2840 | 2000 | 1190 | 1430 | 919 | 544 | 1588.25 |
| 1966 | 450 | 385 | 416 | 1260 | 3400 | 3770 | 3060 | 2070 | 1460 | 1480 | 915 | 487 | 1596.08 |
| 1967 | 368 | 357 | 360 | 1000 | 3940 | 5380 | 3370 | 2040 | 1310 | 1120 | 1140 | 665 | 1754.17 |
| 1968 | 575 | 592 | 787 | 1040 | 3210 | 4060 | 3710 | 1980 | 1750 | 1380 | 1200 | 580 | 1738.67 |
| 1969 | 472 | 415 | 392 | 1450 | 2290 | 2730 | 1780 | 1820 | 1740 | 1420 | 1110 | 718 | 1361.42 |
| 1970 | 473 | 485 | 478 | 927 | 2510 | 3800 | 2200 | 1520 | 1220 | 1040 | 564 | 377 | 1299.5 |
| 1971 | 354 | 394 | 354 | 1060 | 3230 | 3510 | 2670 | 1780 | 1330 | 1120 | 883 | 459 | 1428.67 |
| 1972 | 345 | 368 | 626 | 1380 | 3740 | 5100 | 3400 | 2150 | 1290 | 1280 | 897 | 510 | 1757.17 |
| 1973 | 430 | 388 | 411 | 1010 | 3000 | 3430 | 2640 | 1520 | 999 | 1360 | 405 | 294 | 1323.92 |
| 1974 | 323 | 357 | 394 | 1583 | 3709 | 4049 | 3568 | 1928 | 1093 | 1184 | 691 | 436 | 1609.58 |
| 1975 | 355 | 336 | 320 | 659 | 2260 | 3120 | 2910 | 1770 | 1210 | 994 | 1100 | 603 | 1303.08 |
| 1976 | 471 | 466 | 437 | 1620 | 4460 | 4110 | 4050 | 3430 | 2300 | 1410 | 1030 | 867 | 2054.25 |
| 1977 | 648 | 655 | 684 | 1800 | 3020 | 3460 | 3100 | 2120 | 1280 | 1010 | 702 | 455 | 1577.83 |
| 1978 | 414 | 422 | 430 | 1100 | 2010 | 2480 | 1980 | 1410 | 1240 | 1100 | 873 | 512 | 1164.25 |
| 1979 | 380 | 361 | 380 | 779 | 3320 | 3830 | 2890 | 1360 | 819 | 668 | 349 | 289 | 1285.42 |
| 1980 | 281 | 277 | 272 | 1100 | 2560 | 2330 | 2050 | 1350 | 1540 | 1080 | 701 | 829 | 1197.5 |
| 1981 | 902 | 690 | 630 | 1030 | 2640 | 3000 | 2220 | 1660 | 945 | 602 | 839 | 418 | 1298 |
| 1982 | 313 | 316 | 311 | 504 | 3240 | 4150 | 3360 | 2360 | 1880 | 1070 | 655 | 461 | 1551.67 |
| 1983 | 388 | 388 | 528 | 1020 | 1610 | 2580 | 2470 | 1640 | 1090 | 783 | 910 | 408 | 1151.25 |
| 1984 | 494 | 472 | 621 | 1210 | 1530 | 3020 | 3050 | 1870 | 1680 | 1350 | 638 | 403 | 1361.5 |
| |
|
|
|
|
|
|
|
|
|
|
|
|
|
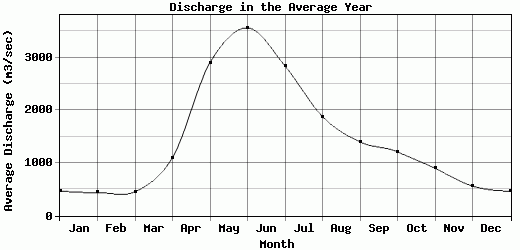
| Avg | 464.17 | 438.33 | 456.47 | 1101.38 | 2905.4 | 3566.54 | 2843.09 | 1881.94 | 1399.86 | 1211.2 | 899.97 | 562.87 | 1438.69 |
| |
|
|
|
|
|
|
|
|
|
|
|
|
|
| Std Dev | 157.35 |
132.58 |
152.19 |
354.48 |
652.95 |
693.61 |
591.87 |
450.95 |
375.36 |
353.39 |
299.45 |
200.99 |
223.03 |
| |
|
|
|
|
|
|
|
|
|
|
|
|
|
| | Jan | Feb | Mar | Apr | May | Jun | Jul | Aug | Sep | Oct | Nov | Dec | Avg Annual |
Click here for this table in tab-delimited format.
Tab-delimited format will open in most table browsing software, i.e. Excel, etc.
View this station on the map.
Return to start.