Results
| Country: | U.S.A.
| | Station: | KNOXVILLE, TN | | River: | FRENCH BROAD RIVER | | Area: | 15565254.52 | | Lat: | 35.96 | | Lon: | -83.77 | | Source: | USGS | | PointID: | 3470500 | | Area Units: | km2 | | Discharge Units: | m3/sec | | Starting Year: | 1934 | | Ending Year: | 1965 | | Total Years: | 32 | | Total Usable Years: | 31 | |
| |
| Year | Jan | Feb | Mar | Apr | May | Jun | Jul | Aug | Sep | Oct | Nov | Dec | Avg Annual |
|---|
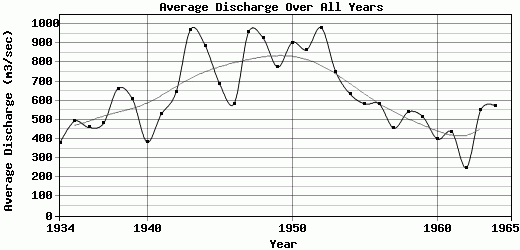
| 1934 | 205.8 | 359.63 | 599.41 | 540.67 | 703.63 | 781.36 | 414.92 | 205.87 | 134.55 | 215.36 | 254.01 | 143.32 | 379.88 |
| 1935 | 139.48 | 237.46 | 336.15 | 582.2 | 502.58 | 1610.67 | 1265.31 | 401.22 | 238.62 | 222.54 | 159.48 | 217.13 | 492.74 |
| 1936 | 161.41 | 166.58 | 759.63 | 742.94 | 811.78 | 1122.01 | 552.73 | 301.74 | 231.21 | 228.69 | 288.34 | 156.61 | 460.31 |
| 1937 | 166.43 | 147.25 | 382.92 | 678.1 | 441.93 | 1551.02 | 1262.66 | 345.1 | 185.67 | 280.8 | 210.42 | 122.06 | 481.2 |
| 1938 | 175.66 | 150.59 | 950.72 | 402.38 | 439.1 | 1441.15 | 1920.62 | 732.68 | 617.12 | 447.59 | 415.45 | 272.04 | 663.76 |
| 1939 | 318.89 | 215.51 | 890.71 | 1248.5 | 862.66 | 1396.12 | 917.47 | 393.33 | 255.83 | 251.99 | 290.46 | 237.04 | 606.54 |
| 1940 | 92.35 | 126.06 | 181.23 | 531.13 | 594.38 | 833.84 | 556.29 | 574.29 | 359.25 | 373.57 | 179.41 | 209.82 | 384.3 |
| 1941 | 156.11 | 169.09 | 251.56 | 720.86 | 595.57 | 1523.36 | 648.09 | 610.82 | 646.85 | 518.02 | 349.02 | 195.15 | 532.04 |
| 1942 | 160.31 | 228.96 | 493.04 | 673.76 | 1140.72 | 1741.21 | 945.79 | 570.91 | 544.25 | 563.97 | 515.18 | 147.94 | 643.84 |
| 1943 | 204.98 | 277.71 | 1051.84 | 2368.72 | 676.96 | 1847.5 | 1711.99 | 751.41 | 816.47 | 766.57 | 727.94 | 466.5 | 972.38 |
| 1944 | 384.11 | 383.84 | 308.2 | 1965.67 | 605.53 | 2414.31 | 1517.61 | 745.74 | 605.04 | 647 | 657.05 | 422.29 | 888.03 |
| 1945 | 416.81 | 486.75 | 1288.88 | 539.72 | 383.56 | 1146.65 | 1233.43 | 642.61 | 681.02 | 757.53 | 463.08 | 209.36 | 687.45 |
| 1946 | 225.53 | 216.42 | 620.14 | 409.75 | 598.31 | 1257.94 | 1015.39 | 555.56 | 754.36 | 751.41 | 390.84 | 224.16 | 584.98 |
| 1947 | 251.38 | 334.34 | 700.34 | 1635.4 | 1234.99 | 1941.04 | 1496.96 | 1026.81 | 889.63 | 995.84 | 645.82 | 351.77 | 958.69 |
| 1948 | 314.41 | 273.6 | 906.42 | 1363.37 | 911.72 | 1878.27 | 1609.5 | 1007.63 | 827.8 | 1029.55 | 754.84 | 239.42 | 926.38 |
| 1949 | 338.34 | 354.27 | 1009.64 | 1852.4 | 845.67 | 1110.5 | 834.07 | 739.9 | 733.79 | 745.74 | 502.44 | 236.77 | 775.29 |
| 1950 | 226.35 | 224.01 | 551.91 | 2888.81 | 1102.9 | 1131.08 | 1145.47 | 847.96 | 855.83 | 885.87 | 636.28 | 354.51 | 904.25 |
| 1951 | 422.56 | 361.04 | 468.24 | 1576.79 | 826.13 | 1266.71 | 1005.25 | 1032.38 | 1093.41 | 1104.09 | 897.18 | 340.26 | 866.17 |
| 1952 | 376.34 | 511.46 | 395.98 | 4086.71 | 1166.2 | 1271.53 | 749.03 | 771.59 | 788.82 | 794.15 | 580.12 | 272.21 | 980.34 |
| 1953 | 338.71 | 346.88 | 568.26 | 566.53 | 791.78 | 1882.89 | 952.55 | 814.25 | 821 | 937.75 | 699.52 | 278.6 | 749.89 |
| 1954 | 243.98 | 316.44 | 540.03 | 671.4 | 723.45 | 616.84 | 753.05 | 1108.2 | 1108.42 | 916.65 | 393.04 | 211.67 | 633.6 |
| 1955 | 200.79 | 209.92 | 263.69 | 372.01 | 1060.88 | 723.12 | 887.42 | 696.69 | 874.62 | 909.71 | 552.65 | 245.08 | 583.05 |
| 1956 | 250.29 | 183.96 | 508.24 | 807.6 | 804.66 | 960.04 | 895.18 | 816.35 | 593.52 | 454.44 | 422.02 | 289.89 | 582.18 |
| 1957 | 292.3 | 374.19 | 415.8 | 530.38 | 717.79 | 547.18 | 508.06 | 597.4 | 504.42 | 396.89 | 298.6 | 291.51 | 456.21 |
| 1958 | 350.86 | 389.66 | 497.28 | 657.9 | 605.53 | 837.81 | 543.69 | 266.02 | 781.27 | 677.96 | 530.94 | 360.4 | 541.61 |
| 1959 | 222.97 | 404.23 | 544.69 | 590.13 | 620.23 | 640.91 | 674.22 | 577.12 | 585.12 | 526.06 | 323.27 | 487.78 | 516.39 |
| 1960 | 340.35 | 160.63 | 145.79 | 87.76 | 157.93 | 415.6 | 724.09 | 772.51 | 686.78 | 653.85 | 237.93 | 406.21 | 399.12 |
| 1961 | 191.64 | 182.46 | 223.86 | 717.36 | 709.66 | 531.76 | 766.02 | 759.72 | 427.52 | 329.69 | 187.9 | 224.13 | 437.64 |
| 1962 | 147.53 | 97.9 | 76.55 | 211.49 | 495.64 | 123.42 | 153.82 | 327 | 233.17 | 379.2 | 333.11 | 432.55 | 250.95 |
| 1963 | 407.62 | 387.54 | 306.78 | 516.79 | 831.52 | 743.32 | 748.88 | 683.08 | 472.04 | 476.23 | 424.42 | 637.68 | 552.99 |
| 1964 | 611.37 | 508.34 | 582.87 | 561.17 | 427.22 | 628.97 | 786.66 | 861.48 | 388.04 | 363.33 | 536.16 | 612.29 | 572.32 |
| 1965 | -9999 | -9999 | -9999 | -9999 | -9999 | -9999 | -9999 | -9999 | -9999 | -9999 | -9999 | -9999 | -9999 |
| |
|
|
|
|
|
|
|
|
|
|
|
|
|
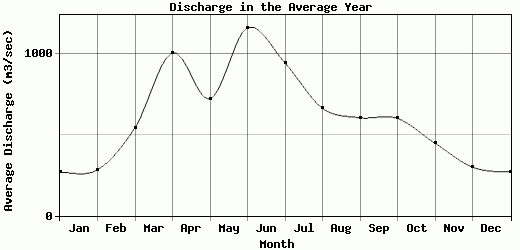
| Avg | 268.89 | 283.44 | 542.61 | 1003.17 | 722.28 | 1158.65 | 941.81 | 662.5 | 604.37 | 600.07 | 447 | 299.88 | 627.89 |
| |
|
|
|
|
|
|
|
|
|
|
|
|
|
| Std Dev | 110.3 |
114.16 |
285.96 |
854.35 |
245.9 |
529.66 |
398.11 |
231.46 |
258.41 |
261.99 |
187.3 |
126.94 |
194.85 |
| |
|
|
|
|
|
|
|
|
|
|
|
|
|
| | Jan | Feb | Mar | Apr | May | Jun | Jul | Aug | Sep | Oct | Nov | Dec | Avg Annual |
Click here for this table in tab-delimited format.
Tab-delimited format will open in most table browsing software, i.e. Excel, etc.
View this station on the map.
Return to start.