Results
| Country: | Senegal
| | Station: | Wassadou-Amout | | River: | Gambie | | Area: | 21200 km2 | | Lat: | 13.35 | | Lon: | -13.36 | | Source: | RivDIS | | PointID: | 1018 | | Area Units: | km2 | | Discharge Units: | m3/sec | | Starting Year: | 1976 | | Ending Year: | 1989 | | Total Years: | 14 | | Total Usable Years: | 12 | |
| |
| Year | Jan | Feb | Mar | Apr | May | Jun | Jul | Aug | Sep | Oct | Nov | Dec | Avg Annual |
|---|
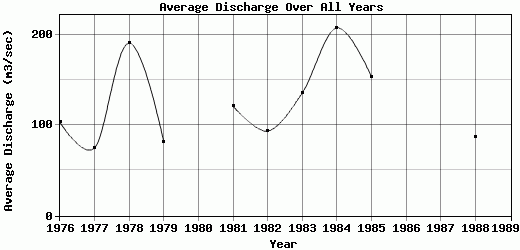
| 1976 | 15.5 | 7.2 | 2.4 | 0.72 | 0.46 | 2.9 | 151 | 313 | 310 | 271 | 129 | 36 | 103.27 |
| 1977 | 6.5 | 2.5 | 0.81 | 0.39 | 0.44 | 4.7 | 25 | 119 | 460 | 217 | 47.5 | 15 | 74.9 |
| 1978 | 18 | 6.3 | 1.9 | 0.62 | 0.32 | 6.5 | 112 | 545 | 756 | 641 | 155 | 47 | 190.8 |
| 1979 | 9.4 | 3.7 | 1.1 | 0.36 | 0.48 | 2.4 | 63 | 230 | 307 | 264 | 72.5 | 21 | 81.25 |
| 1980 | -9999 | -9999 | -9999 | -9999 | 0.1 | 7 | 136 | 842 | 679 | 179 | 64.5 | 31.3 | -9999 |
| 1981 | 14.4 | 7.88 | 3.49 | 1.25 | 0.68 | 10.5 | 83.4 | 512 | 564 | 188 | 49.6 | 19.4 | 121.22 |
| 1982 | 8.72 | 4.37 | 1.59 | 0.8 | 1.07 | 26 | 110 | 381 | 366 | 144 | 54.3 | 26.5 | 93.7 |
| 1983 | 12.4 | 0.05 | 2.36 | 0.88 | 0.46 | 12.7 | 76.1 | 673 | 637 | 142 | 49.8 | 20.8 | 135.63 |
| 1984 | 9.74 | 4.32 | 1.6 | 0.75 | 0.32 | 13.6 | 236 | 738 | 892 | 480 | 85.2 | 32.3 | 207.82 |
| 1985 | 13.1 | 6.8 | 2.2 | 0.4 | 0.53 | 0.85 | 111 | 197 | 931 | 482 | 73.3 | 27.2 | 153.78 |
| 1986 | 9.36 | 3.72 | 1.09 | 0.35 | -9999 | -9999 | -9999 | -9999 | -9999 | -9999 | -9999 | -9999 | -9999 |
| 1987 | -9999 | -9999 | -9999 | -9999 | 0.69 | 2.53 | 50.2 | 411 | 566 | 143 | 43.1 | 16.1 | -9999 |
| 1988 | 7.11 | 2.61 | 0.83 | 0.29 | 0.18 | 1.18 | 61.5 | 209 | 497 | 198 | 51.8 | 18.7 | 87.35 |
| 1989 | 7.98 | 2.58 | 0.95 | 0.26 | -9999 | -9999 | -9999 | -9999 | -9999 | -9999 | -9999 | -9999 | -9999 |
| |
|
|
|
|
|
|
|
|
|
|
|
|
|
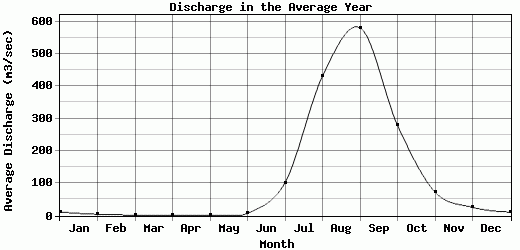
| Avg | 11.02 | 4.34 | 1.69 | 0.59 | 0.48 | 7.57 | 101.27 | 430.83 | 580.42 | 279.08 | 72.97 | 25.94 | 124.97 |
| |
|
|
|
|
|
|
|
|
|
|
|
|
|
| Std Dev | 3.46 |
2.22 |
0.78 |
0.29 |
0.25 |
6.96 |
53.65 |
223.59 |
199.9 |
157.35 |
33.55 |
9.03 |
44.09 |
| |
|
|
|
|
|
|
|
|
|
|
|
|
|
| | Jan | Feb | Mar | Apr | May | Jun | Jul | Aug | Sep | Oct | Nov | Dec | Avg Annual |
Click here for this table in tab-delimited format.
Tab-delimited format will open in most table browsing software, i.e. Excel, etc.
View this station on the map.
Return to start.