Results
| Country: | India
| | Station: | Farakka | | River: | Ganga | | Area: | -9999 km2 | | Lat: | 24.83 | | Lon: | 87.92 | | Source: | RivDIS | | PointID: | 863 | | Area Units: | km2 | | Discharge Units: | m3/sec | | Starting Year: | 1949 | | Ending Year: | 1973 | | Total Years: | 25 | | Total Usable Years: | 21 | |
| |
| Year | Jan | Feb | Mar | Apr | May | Jun | Jul | Aug | Sep | Oct | Nov | Dec | Avg Annual |
|---|
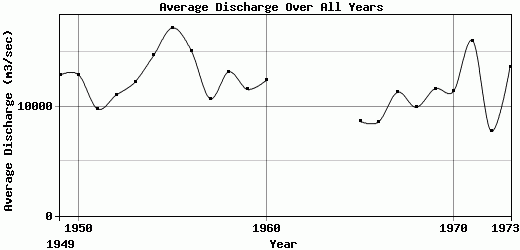
| 1949 | 3249 | 3058 | 2516 | 2105 | 2981 | 5883 | 17810 | 43997 | 40283 | 18745 | 9773 | 4480 | 12906.7 |
| 1950 | 3238 | 2892 | 2365 | 2039 | 1977 | 6665 | 26673 | 51340 | 36951 | 11591 | 5457 | 3659 | 12903.9 |
| 1951 | 2919 | 2589 | 2091 | 1850 | 1957 | 4491 | 21305 | 31333 | 30134 | 10768 | 4580 | 3268 | 9773.75 |
| 1952 | 2309 | 1685 | 1411 | 1294 | 1627 | 3936 | 24815 | 40802 | 33333 | 11953 | 5820 | 3761 | 11062.2 |
| 1953 | 2304 | 1946 | 1564 | 1228 | 1359 | 2942 | 24569 | 49411 | 36982 | 15014 | 5966 | 3717 | 12250.2 |
| 1954 | 2798 | 2410 | 2607 | 1985 | 1937 | 5696 | 23134 | 62694 | 41424 | 20759 | 6991 | 3887 | 14693.5 |
| 1955 | 2807 | 2668 | 2008 | 1499 | 1705 | 3891 | 33922 | 61363 | 52121 | 29764 | 9754 | 5106 | 17217.3 |
| 1956 | 3460 | 2829 | 2235 | 1937 | 2807 | 10199 | 23482 | 47602 | 43415 | 27375 | 10719 | 5399 | 15121.6 |
| 1957 | 4224 | 3508 | 2641 | 2176 | 1922 | 2484 | 17856 | 39765 | 37021 | 9705 | 4473 | 3042 | 10734.8 |
| 1958 | 2449 | 2154 | 1849 | 1652 | 1954 | 2423 | 14350 | 53410 | 39848 | 26097 | 7733 | 4224 | 13178.6 |
| 1959 | 2978 | 3062 | 2342 | 1866 | 1864 | 3980 | 14250 | 43717 | 32093 | 21400 | 7424 | 3924 | 11575 |
| 1960 | 2667 | 2119 | 1962 | 1693 | 1535 | 3188 | 19448 | 40943 | 39015 | 23856 | 7917 | 4468 | 12400.9 |
| 1961 | -9999 | -9999 | -9999 | -9999 | -9999 | -9999 | -9999 | -9999 | -9999 | -9999 | -9999 | -9999 | -9999 |
| 1962 | -9999 | -9999 | -9999 | -9999 | -9999 | -9999 | -9999 | -9999 | -9999 | -9999 | -9999 | -9999 | -9999 |
| 1963 | -9999 | -9999 | -9999 | -9999 | -9999 | -9999 | -9999 | -9999 | -9999 | -9999 | -9999 | -9999 | -9999 |
| 1964 | -9999 | -9999 | -9999 | -9999 | -9999 | -9999 | -9999 | -9999 | -9999 | -9999 | -9999 | -9999 | -9999 |
| 1965 | 3087 | 2431 | 2124 | 2122 | 2915 | 3492 | 12090 | 27790 | 27810 | 10160 | 6153 | 3591 | 8647.08 |
| 1966 | 2726 | 2341 | 1972 | 1403 | 1429 | 2762 | 14690 | 35570 | 26270 | 7131 | 3831 | 3070 | 8599.58 |
| 1967 | 2394 | 2083 | 1509 | 1494 | 1636 | 3232 | 18950 | 34340 | 45930 | 15280 | 4990 | 3863 | 11308.4 |
| 1968 | 3051 | 2360 | 1843 | 1608 | 1576 | 4232 | 23437 | 37104 | 19331 | 15874 | 5483 | 3363 | 9938.5 |
| 1969 | 2265 | 1773 | 1491 | 1472 | 1710 | 4112 | 17004 | 46262 | 35098 | 17855 | 6636 | 3977 | 11637.9 |
| 1970 | 2564 | 2145 | 1999 | 1754 | 1950 | 4948 | 22358 | 34186 | 38992 | 16894 | 5668 | 3463 | 11410.1 |
| 1971 | 2408 | 1962 | 1782 | 1969 | 2594 | 1181 | 33815 | 65072 | 49568 | 17490 | 9401 | 5365 | 16050.6 |
| 1972 | 3181 | 2697 | 2387 | 2032 | 2032 | 3834 | 14047 | 19042 | 24693 | 10686 | 4786 | 3371 | 7732.33 |
| 1973 | 2289 | 2086 | 1605 | 1594 | 2207 | 7032 | 18657 | 37886 | 44573 | 31053 | 10015 | 4677 | 13639.5 |
| |
|
|
|
|
|
|
|
|
|
|
|
|
|
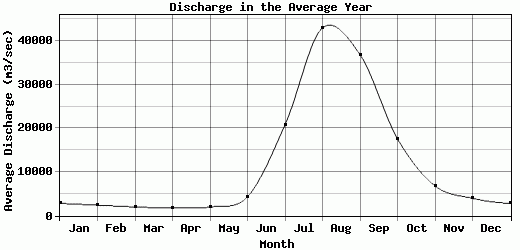
| Avg | 2827 | 2418.95 | 2014.43 | 1751.05 | 1984.48 | 4314.43 | 20793.4 | 43029.9 | 36899.3 | 17592.9 | 6836.67 | 3984.52 | 12037.2 |
| |
|
|
|
|
|
|
|
|
|
|
|
|
|
| Std Dev | 474.74 |
459.05 |
365.83 |
278.99 |
460.52 |
1917.46 |
5830.28 |
11327 |
8055.33 |
6785.66 |
2023.11 |
685.34 |
2394.23 |
| |
|
|
|
|
|
|
|
|
|
|
|
|
|
| | Jan | Feb | Mar | Apr | May | Jun | Jul | Aug | Sep | Oct | Nov | Dec | Avg Annual |
Click here for this table in tab-delimited format.
Tab-delimited format will open in most table browsing software, i.e. Excel, etc.
View this station on the map.
Return to start.