Results
| Country: | France
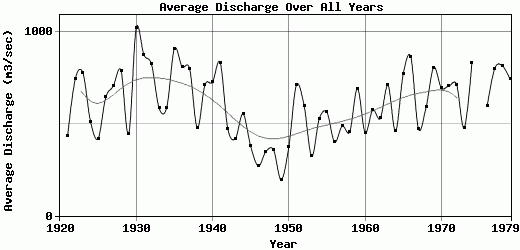
| | Station: | Masd'Agenais | | River: | Garonne | | Area: | 52000 km2 | | Lat: | 44.42 | | Lon: | 0.24 | | Source: | RivDIS | | PointID: | 736 | | Area Units: | km2 | | Discharge Units: | m3/sec | | Starting Year: | 1920 | | Ending Year: | 1979 | | Total Years: | 60 | | Total Usable Years: | 58 | |
| |
| Year | Jan | Feb | Mar | Apr | May | Jun | Jul | Aug | Sep | Oct | Nov | Dec | Avg Annual |
|---|
| 1920 | -9999 | -9999 | -9999 | -9999 | -9999 | -9999 | -9999 | -9999 | -9999 | 961 | 886 | 874 | -9999 |
| 1921 | 561 | 842 | 392 | 519 | 959 | 562 | 215 | 301 | 215 | 144 | 167 | 327 | 433.67 |
| 1922 | 534 | 1188 | 723 | 2453 | 1526 | 796 | 311 | 166 | 249 | 219 | 454 | 289 | 742.33 |
| 1923 | 698 | 1307 | 1628 | 1621 | 739 | 448 | 293 | 146 | 160 | 147 | 437 | 1700 | 777 |
| 1924 | 1692 | 624 | 549 | 846 | 576 | 342 | 195 | 212 | 168 | 225 | 346 | 367 | 511.83 |
| 1925 | 216 | 332 | 468 | 1119 | 859 | 499 | 308 | 172 | 142 | 151 | 391 | 371 | 419 |
| 1926 | 895 | 1144 | 403 | 1111 | 1589 | 766 | 320 | 155 | 177 | 159 | 600 | 396 | 642.92 |
| 1927 | 689 | 399 | 2210 | 1082 | 740 | 453 | 359 | 248 | 435 | 296 | 469 | 1100 | 706.67 |
| 1928 | 1114 | 1345 | 1489 | 1461 | 1047 | 551 | 267 | 148 | 149 | 199 | 943 | 751 | 788.67 |
| 1929 | 589 | 450 | 390 | 290 | 700 | 450 | 176 | 167 | 213 | 349 | 764 | 812 | 445.83 |
| 1930 | 1600 | 1286 | 2400 | 1322 | 1279 | 844 | 454 | 306 | 228 | 607 | 782 | 1151 | 1021.58 |
| 1931 | 1588 | 1760 | 2125 | 711 | 900 | 495 | 295 | 272 | 379 | 388 | 877 | 715 | 875.42 |
| 1932 | 585 | 443 | 601 | 1030 | 1326 | 1306 | 1222 | 463 | 367 | 587 | 487 | 1456 | 822.75 |
| 1933 | 491 | 822 | 1094 | 567 | 518 | 560 | 392 | 197 | 181 | 776 | 786 | 624 | 584 |
| 1934 | 562 | 255 | 1360 | 1226 | 915 | 400 | 215 | 199 | 202 | 167 | 372 | 1188 | 588.42 |
| 1935 | 1053 | 950 | 2023 | 1116 | 810 | 562 | 248 | 187 | 221 | 305 | 819 | 2602 | 908 |
| 1936 | 1680 | 1977 | 1214 | 1263 | 1121 | 851 | 420 | 232 | 199 | 218 | 269 | 288 | 811 |
| 1937 | 363 | 1708 | 1677 | 1424 | 797 | 472 | 295 | 154 | 148 | 528 | 516 | 1493 | 797.92 |
| 1938 | 986 | 1040 | 382 | 266 | 402 | 381 | 207 | 160 | 308 | 394 | 450 | 758 | 477.83 |
| 1939 | 1436 | 820 | 950 | 1085 | 959 | 645 | 422 | 259 | 207 | 243 | 587 | 914 | 710.58 |
| 1940 | 454 | 901 | 565 | 742 | 1844 | 991 | 525 | 232 | 222 | 455 | 462 | 1323 | 726.33 |
| 1941 | 1308 | 2279 | 1286 | 720 | 810 | 1221 | 405 | 276 | 238 | 263 | 674 | 502 | 831.83 |
| 1942 | 862 | 1046 | 910 | 714 | 647 | 345 | 203 | 142 | 163 | 184 | 274 | 187 | 473.08 |
| 1943 | 642 | 578 | 388 | 361 | 361 | 223 | 145 | 120 | 151 | 377 | 602 | 1081 | 419.08 |
| 1944 | 371 | 474 | 369 | 761 | 343 | 214 | 177 | 137 | 165 | 503 | 1187 | 1950 | 554.25 |
| 1945 | 1024 | 1261 | 400 | 343 | 248 | 190 | 124 | 108 | 128 | 97 | 140 | 463 | 377.17 |
| 1946 | 307 | 392 | 418 | 373 | 492 | 461 | 177 | 80 | 76 | 60 | 105 | 300 | 270.08 |
| 1947 | 546 | 624 | 777 | 628 | 354 | 222 | 110 | 70 | 84 | 139 | 215 | 413 | 348.5 |
| 1948 | 1130 | 648 | 252 | 278 | 696 | 546 | 166 | 147 | 161 | 72 | 98 | 103 | 358.08 |
| 1949 | 144 | 96 | 166 | 141 | 255 | 239 | 72 | 42 | 52 | 69 | 503 | 563 | 195.17 |
| 1950 | 295 | 929 | 534 | 696 | 495 | 276 | 89 | 50 | 74 | 74 | 373 | 594 | 373.25 |
| 1951 | 996 | 1202 | 1635 | 772 | 998 | 1116 | 349 | 204 | 145 | 180 | 569 | 359 | 710.42 |
| 1952 | 1127 | 1394 | 768 | 586 | 450 | 276 | 123 | 87 | 78 | 205 | 753 | 1342 | 599.08 |
| 1953 | 527 | 520 | 319 | 289 | 282 | 291 | 235 | 87 | 75 | 232 | 248 | 776 | 323.42 |
| 1954 | 386 | 968 | 1037 | 625 | 915 | 411 | 238 | 214 | 235 | 184 | 239 | 873 | 527.08 |
| 1955 | 2684 | 1691 | 438 | 264 | 231 | 240 | 156 | 96 | 137 | 169 | 148 | 487 | 561.75 |
| 1956 | 671 | 419 | 530 | 506 | 708 | 530 | 301 | 171 | 274 | 197 | 247 | 258 | 401 |
| 1957 | 383 | 1187 | 559 | 841 | 604 | 1337 | 278 | 125 | 107 | 86 | 165 | 176 | 487.33 |
| 1958 | 514 | 379 | 1118 | 1034 | 481 | 277 | 290 | 108 | 85 | 155 | 275 | 773 | 457.42 |
| 1959 | 957 | 532 | 497 | 1077 | 996 | 541 | 231 | 151 | 305 | 229 | 425 | 2354 | 691.25 |
| 1960 | 907 | 474 | 794 | 435 | 319 | 245 | 189 | 138 | 125 | 571 | 579 | 648 | 452 |
| 1961 | 1903 | 1541 | 395 | 425 | 444 | 418 | 215 | 151 | 89 | 231 | 331 | 751 | 574.5 |
| 1962 | 820 | 560 | 590 | 1380 | 595 | 452 | 178 | 105 | 74 | 101 | 645 | 845 | 528.75 |
| 1963 | 775 | 965 | 1060 | 1400 | 525 | 815 | 358 | 351 | 655 | 290 | 650 | 660 | 708.67 |
| 1964 | 263 | 565 | 1180 | 1140 | 730 | 445 | 172 | 112 | 101 | 270 | 260 | 280 | 459.83 |
| 1965 | 895 | 409 | 870 | 695 | 836 | 525 | 233 | 117 | 348 | 515 | 885 | 2910 | 769.83 |
| 1966 | 2110 | 1420 | 660 | 735 | 1300 | 520 | 289 | 186 | 142 | 391 | 655 | 1940 | 862.33 |
| 1967 | 1330 | 880 | 780 | 450 | 510 | 405 | 273 | 168 | 144 | 117 | 288 | 318 | 471.92 |
| 1968 | 1070 | 775 | 595 | 630 | 790 | 795 | 298 | 215 | 275 | 219 | 436 | 975 | 589.42 |
| 1969 | 1100 | 895 | 1700 | 1110 | 1410 | 578 | 338 | 217 | 434 | 463 | 455 | 973 | 806.08 |
| 1970 | 985 | 2080 | 1160 | 1130 | 1080 | 725 | 284 | 163 | 117 | 199 | 212 | 202 | 694.75 |
| 1971 | 610 | 1670 | 1120 | 1280 | 1010 | 1110 | 422 | 213 | 199 | 172 | 258 | 406 | 705.83 |
| 1972 | 1210 | 1910 | 1040 | 1040 | 835 | 680 | 387 | 230 | 303 | 227 | 285 | 398 | 712.08 |
| 1973 | 550 | 1060 | 660 | 441 | 595 | 480 | 266 | 159 | 120 | 255 | 187 | 945 | 476.5 |
| 1974 | 640 | 1420 | 1350 | 1120 | 830 | 515 | 275 | 218 | 550 | 840 | 1200 | 980 | 828.17 |
| 1975 | -9999 | -9999 | -9999 | -9999 | -9999 | -9999 | -9999 | -9999 | -9999 | -9999 | -9999 | -9999 | -9999 |
| 1976 | 293 | 720 | 515 | 625 | 680 | 293 | 187 | 105 | 185 | 855 | 1160 | 1530 | 595.67 |
| 1977 | 845 | 1390 | 725 | 720 | 1640 | 1020 | 965 | 665 | 327 | 406 | 384 | 520 | 800.58 |
| 1978 | 835 | 2120 | 1480 | 1430 | 1470 | 830 | 505 | 297 | 210 | 192 | 165 | 261 | 816.25 |
| 1979 | 950 | 1540 | 975 | 1170 | 1170 | 700 | 230 | 157 | 139 | 462 | 565 | 860 | 743.17 |
| |
|
|
|
|
|
|
|
|
|
|
|
|
|
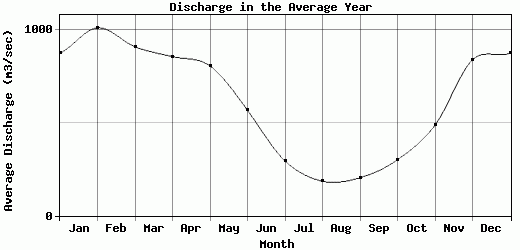
| Avg | 875.02 | 1010.45 | 908.5 | 855.5 | 805.88 | 566.91 | 294.34 | 185.48 | 204.14 | 301.17 | 486.51 | 838.22 | 609.44 |
| |
|
|
|
|
|
|
|
|
|
|
|
|
|
| Std Dev | 496.83 |
526.09 |
528.39 |
428.82 |
378.97 |
282.23 |
182.38 |
98.69 |
117.84 |
205.1 |
273.71 |
603.83 |
181.59 |
| |
|
|
|
|
|
|
|
|
|
|
|
|
|
| | Jan | Feb | Mar | Apr | May | Jun | Jul | Aug | Sep | Oct | Nov | Dec | Avg Annual |
Click here for this table in tab-delimited format.
Tab-delimited format will open in most table browsing software, i.e. Excel, etc.
View this station on the map.
Return to start.