Results
| Country: | Canada
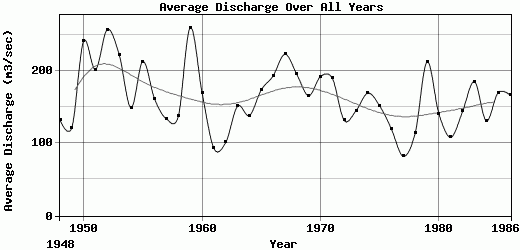
| | Station: | GodsLake | | River: | GodsRiver | | Area: | 25900 km2 | | Lat: | 54.84 | | Lon: | -94.08 | | Source: | RivDIS | | PointID: | 1094 | | Area Units: | km2 | | Discharge Units: | m3/sec | | Starting Year: | 1948 | | Ending Year: | 1986 | | Total Years: | 39 | | Total Usable Years: | 39 | |
| |
| Year | Jan | Feb | Mar | Apr | May | Jun | Jul | Aug | Sep | Oct | Nov | Dec | Avg Annual |
|---|
| 1948 | 222 | 194 | 166 | 152 | 141 | 128 | 125 | 118 | 99 | 86.7 | 78.1 | 73.9 | 131.98 |
| 1949 | 71.9 | 70.3 | 68.8 | 67.6 | 72 | 78.2 | 94.5 | 103 | 115 | 167 | 246 | 302 | 121.36 |
| 1950 | 287 | 244 | 205 | 179 | 184 | 236 | 284 | 307 | 295 | 254 | 212 | 201 | 240.67 |
| 1951 | 189 | 171 | 155 | 142 | 157 | 179 | 196 | 206 | 224 | 264 | 275 | 259 | 201.42 |
| 1952 | 223 | 189 | 164 | 146 | 152 | 189 | 258 | 339 | 387 | 375 | 339 | 320 | 256.75 |
| 1953 | 276 | 233 | 197 | 173 | 169 | 173 | 259 | 294 | 276 | 223 | 199 | 190 | 221.83 |
| 1954 | 173 | 158 | 146 | 135 | 130 | 140 | 164 | 172 | 159 | 143 | 134 | 130 | 148.67 |
| 1955 | 131 | 126 | 121 | 121 | 147 | 198 | 267 | 337 | 319 | 287 | 265 | 233 | 212.67 |
| 1956 | 199 | 177 | 163 | 154 | 151 | 164 | 182 | 179 | 160 | 141 | 132 | 123 | 160.42 |
| 1957 | 117 | 112 | 108 | 106 | 113 | 130 | 160 | 178 | 167 | 150 | 136 | 122 | 133.25 |
| 1958 | 117 | 113 | 107 | 104 | 106 | 115 | 138 | 172 | 172 | 170 | 168 | 166 | 137.33 |
| 1959 | 155 | 148 | 140 | 137 | 161 | 276 | 404 | 410 | 359 | 332 | 309 | 277 | 259 |
| 1960 | 243 | 206 | 153 | 147 | 162 | 178 | 195 | 191 | 166 | 143 | 131 | 119 | 169.5 |
| 1961 | 111 | 104 | 97.7 | 91.3 | 97.7 | 103 | 98.4 | 94.7 | 89.4 | 81.2 | 80.8 | 63.9 | 92.76 |
| 1962 | 57.1 | 62.6 | 72.6 | 83.7 | 88.5 | 105 | 119 | 122 | 131 | 131 | 125 | 115 | 101.04 |
| 1963 | 103 | 101 | 107 | 113 | 130 | 171 | 210 | 208 | 189 | 174 | 158 | 148 | 151 |
| 1964 | 138 | 128 | 119 | 116 | 126 | 148 | 167 | 171 | 159 | 140 | 126 | 119 | 138.08 |
| 1965 | 112 | 107 | 102 | 101 | 114 | 163 | 218 | 252 | 247 | 236 | 224 | 205 | 173.42 |
| 1966 | 181 | 159 | 143 | 132 | 136 | 178 | 237 | 264 | 256 | 229 | 207 | 191 | 192.75 |
| 1967 | 174 | 155 | 133 | 128 | 137 | 234 | 352 | 377 | 324 | 259 | 213 | 186 | 222.67 |
| 1968 | 165 | 147 | 133 | 120 | 124 | 163 | 220 | 261 | 271 | 260 | 245 | 229 | 194.83 |
| 1969 | 210 | 190 | 167 | 149 | 138 | 135 | 136 | 134 | 137 | 159 | 198 | 230 | 165.25 |
| 1970 | 231 | 215 | 193 | 168 | 162 | 179 | 200 | 202 | 189 | 181 | 185 | 197 | 191.83 |
| 1971 | 201 | 188 | 174 | 160 | 175 | 210 | 233 | 235 | 214 | 177 | 157 | 147 | 189.25 |
| 1972 | 138 | 128 | 116 | 103 | 119 | 145 | 160 | 162 | 145 | 130 | 119 | 112 | 131.42 |
| 1973 | 107 | 101 | 96.4 | 94.7 | 102 | 134 | 175 | 195 | 179 | 178 | 185 | 189 | 144.67 |
| 1974 | 183 | 166 | 155 | 144 | 146 | 176 | 199 | 208 | 189 | 167 | 153 | 142 | 169 |
| 1975 | 135 | 125 | 119 | 111 | 115 | 129 | 145 | 169 | 188 | 198 | 195 | 186 | 151.25 |
| 1976 | 173 | 158 | 141 | 126 | 119 | 112 | 109 | 106 | 108 | 99.5 | 90.5 | 84 | 118.83 |
| 1977 | 81 | 78 | 76 | 75 | 80.5 | 82.5 | 80.5 | 77.5 | 83.5 | 89.5 | 90 | 88.5 | 81.88 |
| 1978 | 88 | 86.5 | 82.5 | 81.5 | 94 | 109 | 115 | 122 | 123 | 140 | 161 | 166 | 114.04 |
| 1979 | 157 | 153 | 151 | 143 | 154 | 221 | 299 | 317 | 279 | 244 | 225 | 201 | 212 |
| 1980 | 185 | 174 | 162 | 146 | 146 | 145 | 137 | 127 | 117 | 114 | 114 | 116 | 140.25 |
| 1981 | 114 | 109 | 102 | 95.2 | 96.8 | 102 | 110 | 111 | 106 | 107 | 118 | 128 | 108.25 |
| 1982 | 130 | 126 | 119 | 112 | 120 | 134 | 146 | 162 | 174 | 171 | 164 | 166 | 143.67 |
| 1983 | 162 | 153 | 145 | 133 | 144 | 205 | 247 | 253 | 233 | 204 | 180 | 158 | 184.75 |
| 1984 | 140 | 126 | 119 | 117 | 125 | 139 | 155 | 155 | 141 | 128 | 116 | 106 | 130.58 |
| 1985 | 97.9 | 92 | 88.6 | 90.1 | 107 | 150 | 227 | 267 | 265 | 241 | 218 | 193 | 169.72 |
| 1986 | 169 | 151 | 135 | 124 | 154 | 201 | 218 | 213 | 184 | 162 | 149 | 139 | 166.58 |
| |
|
|
|
|
|
|
|
|
|
|
|
|
|
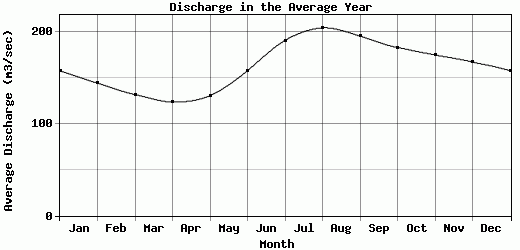
| Avg | 157.61 | 144.22 | 131.86 | 123.62 | 130.65 | 157.89 | 190.75 | 204.39 | 195.36 | 182.97 | 174.88 | 167.21 | 163.45 |
| |
|
|
|
|
|
|
|
|
|
|
|
|
|
| Std Dev | 53.56 |
43.47 |
33.94 |
27.35 |
26.59 |
43.67 |
70.55 |
81.06 |
75.94 |
66.72 |
61.07 |
59.94 |
43.22 |
| |
|
|
|
|
|
|
|
|
|
|
|
|
|
| | Jan | Feb | Mar | Apr | May | Jun | Jul | Aug | Sep | Oct | Nov | Dec | Avg Annual |
Click here for this table in tab-delimited format.
Tab-delimited format will open in most table browsing software, i.e. Excel, etc.
View this station on the map.
Return to start.