Results
| Country: | U.S.A.
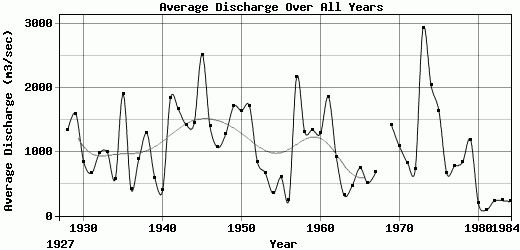
| | Station: | LittleRock, Arkansas | | River: | Arkansas | | Area: | 409453 km2 | | Lat: | 34.75 | | Lon: | -92.26 | | Source: | | | PointID: | 380 | | Area Units: | km2 | | Discharge Units: | m3/sec | | Starting Year: | 1927 | | Ending Year: | 1984 | | Total Years: | 58 | | Total Usable Years: | 56 | |
| |
| Year | Jan | Feb | Mar | Apr | May | Jun | Jul | Aug | Sep | Oct | Nov | Dec | Avg Annual |
|---|
| 1927 | -9999 | -9999 | -9999 | -9999 | -9999 | -9999 | -9999 | -9999 | -9999 | 2378 | 673 | 1296 | -9999 |
| 1928 | 1061 | 951 | 971 | 2973 | 1614 | 3341 | 1393 | 1081 | 300 | 181 | 866 | 1424 | 1346.33 |
| 1929 | 1885 | 1050 | 1554 | 3539 | 4927 | 2916 | 1599 | 291 | 253 | 291 | 314 | 492 | 1592.58 |
| 1930 | 1184 | 1606 | 498 | 213 | 3191 | 1191 | 350 | 130 | 350 | 382 | 256 | 775 | 843.83 |
| 1931 | 217 | 1146 | 743 | 948 | 1021 | 762 | 281 | 348 | 152 | 302 | 739 | 1299 | 663.17 |
| 1932 | 3567 | 2157 | 841 | 673 | 424 | 957 | 1500 | 436 | 156 | 116 | 91 | 767 | 973.75 |
| 1933 | 1376 | 461 | 1152 | 1667 | 2888 | 625 | 214 | 540 | 1463 | 513 | 453 | 493 | 987.08 |
| 1934 | 751 | 241 | 710 | 1468 | 649 | 228 | 84 | 32 | 735 | 527 | 728 | 664 | 568.08 |
| 1935 | 1062 | 536 | 3134 | 1446 | 4278 | 7614 | 1553 | 250 | 391 | 377 | 726 | 1374 | 1895.08 |
| 1936 | 297 | 200 | 297 | 171 | 358 | 557 | 144 | 50 | 194 | 1556 | 635 | 451 | 409.17 |
| 1937 | 2598 | 1535 | 794 | 893 | 752 | 1725 | 410 | 258 | 561 | 212 | 413 | 528 | 889.92 |
| 1938 | 1093 | 3896 | 1138 | 2820 | 2123 | 2660 | 488 | 484 | 248 | 119 | 236 | 155 | 1288.33 |
| 1939 | 336 | 1228 | 872 | 1951 | 1086 | 637 | 577 | 172 | 95 | 50 | 62 | 72 | 594.83 |
| 1940 | 81 | 139 | 135 | 751 | 715 | 420 | 380 | 350 | 522 | 91 | 310 | 822 | 393 |
| 1941 | 1438 | 1493 | 652 | 2240 | 1472 | 2514 | 560 | 341 | 1188 | 4004 | 4898 | 1250 | 1837.5 |
| 1942 | 859 | 1401 | 1236 | 4114 | 3327 | 2272 | 1287 | 622 | 1216 | 856 | 1537 | 1217 | 1662 |
| 1943 | 1463 | 588 | 789 | 1299 | 8220 | 2820 | 680 | 218 | 136 | 298 | 284 | 209 | 1417 |
| 1944 | 366 | 1171 | 2851 | 3525 | 3519 | 1877 | 483 | 368 | 441 | 1055 | 354 | 1320 | 1444.17 |
| 1945 | 734 | 1799 | 5977 | 7758 | 3072 | 3868 | 1684 | 524 | 699 | 3279 | 504 | 325 | 2518.58 |
| 1946 | 2203 | 2306 | 1401 | 1422 | 2896 | 1371 | 686 | 166 | 187 | 274 | 1500 | 2397 | 1400.75 |
| 1947 | 555 | 281 | 556 | 3426 | 3978 | 1927 | 780 | 250 | 195 | 160 | 210 | 496 | 1067.83 |
| 1948 | 868 | 979 | 2412 | 1115 | 1013 | 1525 | 3836 | 2098 | 396 | 202 | 321 | 555 | 1276.67 |
| 1949 | 2402 | 4261 | 2073 | 1393 | 3650 | 3163 | 1086 | 457 | 494 | 645 | 356 | 504 | 1707 |
| 1950 | 2262 | 2216 | 1001 | 592 | 3126 | 1393 | 2289 | 3355 | 2200 | 722 | 300 | 238 | 1641.17 |
| 1951 | 570 | 1885 | 1475 | 915 | 2066 | 2303 | 5026 | 965 | 1371 | 780 | 2032 | 1141 | 1710.75 |
| 1952 | 1030 | 884 | 2289 | 2608 | 1349 | 641 | 175 | 139 | 106 | 67 | 216 | 612 | 843 |
| 1953 | 374 | 522 | 1512 | 1913 | 2150 | 303 | 393 | 241 | 140 | 96 | 176 | 179 | 666.58 |
| 1954 | 398 | 395 | 193 | 302 | 1798 | 411 | 144 | 82 | 51 | 94 | 125 | 147 | 345 |
| 1955 | 457 | 690 | 1273 | 834 | 994 | 1043 | 517 | 177 | 163 | 726 | 158 | 140 | 597.67 |
| 1956 | 155 | 1211 | 272 | 261 | 406 | 250 | 114 | 78 | 38 | 33 | 49 | 110 | 248.08 |
| 1957 | 284 | 910 | 727 | 3828 | 6133 | 7430 | 2882 | 1071 | 722 | 385 | 1163 | 573 | 2175.67 |
| 1958 | 651 | 562 | 2517 | 2437 | 2627 | 1127 | 2684 | 1281 | 628 | 312 | 536 | 323 | 1307.08 |
| 1959 | 295 | 634 | 1372 | 1111 | 1314 | 936 | 1594 | 918 | 444 | 4740 | 1325 | 1418 | 1341.75 |
| 1960 | 1794 | 1448 | 1593 | 1362 | 3406 | 1546 | 1121 | 736 | 612 | 326 | 606 | 872 | 1285.17 |
| 1961 | 470 | 567 | 1535 | 2248 | 4958 | 1950 | 1687 | 1059 | 1970 | 1524 | 2347 | 1967 | 1856.83 |
| 1962 | 1198 | 1419 | 1411 | 1343 | 491 | 1110 | 542 | 413 | 839 | 1077 | 623 | 567 | 919.42 |
| 1963 | 452 | 263 | 877 | 303 | 465 | 235 | 402 | 240 | 248 | 106 | 114 | 91 | 316.33 |
| 1964 | 67 | 175 | 749 | 1035 | 727 | 545 | 268 | 150 | 364 | 169 | 628 | 665 | 461.83 |
| 1965 | 62 | 778 | 771 | 1944 | 866 | 1465 | 874 | 326 | 807 | 658 | 208 | 173 | 744.33 |
| 1966 | 485 | 1027 | 511 | 906 | 1367 | 417 | 233 | 355 | 302 | 208 | 163 | 152 | 510.5 |
| 1967 | 158 | 168 | 249 | 645 | 992 | 584 | 1407 | 637 | 498 | 606 | 973 | 1218 | 677.92 |
| 1968 | -9999 | -9999 | -9999 | -9999 | -9999 | -9999 | -9999 | -9999 | -9999 | -9999 | -9999 | -9999 | -9999 |
| 1969 | 1847 | 2740 | 1800 | 2030 | 2350 | 1880 | 1420 | 587 | 421 | 868 | 469 | 531 | 1411.92 |
| 1970 | 807 | 474 | 1070 | 2220 | 2780 | 1397 | 474 | 232 | 478 | 1490 | 1180 | 378 | 1081.67 |
| 1971 | 1065 | 953 | 866 | 313 | 568 | 718 | 538 | 426 | 519 | 651 | 448 | 2880 | 828.75 |
| 1972 | 1110 | 479 | 280 | 602 | 667 | 172 | 376 | 240 | 225 | 327 | 2830 | 1340 | 720.67 |
| 1973 | 2520 | 2590 | 4700 | 6110 | 5100 | 3080 | 779 | 388 | 476 | 2410 | 2860 | 4220 | 2936.08 |
| 1974 | 1930 | 1340 | 3130 | 1710 | 2010 | 3910 | 814 | 377 | 1400 | 581 | 4980 | 2310 | 2041 |
| 1975 | 1760 | 3060 | 4000 | 2660 | 2220 | 3100 | 841 | 468 | 455 | 256 | 247 | 539 | 1633.83 |
| 1976 | 479 | 334 | 835 | 1180 | 1370 | 950 | 1740 | 314 | 169 | 187 | 152 | 214 | 660.33 |
| 1977 | 297 | 320 | 1200 | 829 | 516 | 1160 | 1310 | 462 | 947 | 536 | 1210 | 485 | 772.67 |
| 1978 | 483 | 768 | 1920 | 1950 | 2020 | 1410 | 435 | 185 | 179 | 41 | 233 | 417 | 836.75 |
| 1979 | 663 | 894 | 2110 | 2640 | 2270 | 2180 | 1090 | 543 | 302 | 120 | 665 | 761 | 1186.5 |
| 1980 | 151 | 139 | 179 | 531 | 543 | 408 | 219 | 32 | 48 | 14.5 | 16 | 18.5 | 191.58 |
| 1981 | 22 | 20 | 19 | 16 | 73 | 162 | 109 | 71.5 | 87 | 49.5 | 325 | 111 | 88.75 |
| 1982 | 45 | 141 | 207 | 73.5 | 695 | 900 | 453 | 148 | 44.5 | 23.5 | 13 | 16.5 | 230 |
| 1983 | 64 | 109 | 186 | 826 | 527 | 380 | 347 | 40 | 36.5 | 158 | 112 | 59.5 | 237.08 |
| 1984 | 40 | 89.5 | 463 | 1013 | 364 | 248 | 143 | 74.5 | 56.5 | 9 | 9 | 122 | 219.29 |
| |
|
|
|
|
|
|
|
|
|
|
|
|
|
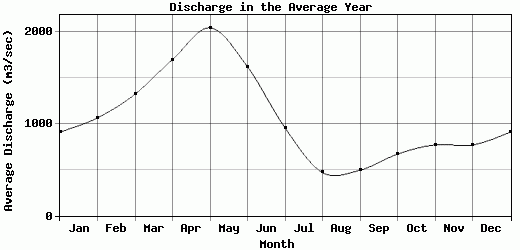
| Avg | 907.88 | 1064.81 | 1322.82 | 1698.13 | 2044.3 | 1619.89 | 955.27 | 469.23 | 494.97 | 670.5 | 771.18 | 769.71 | 1062.55 |
| |
|
|
|
|
|
|
|
|
|
|
|
|
|
| Std Dev | 794.29 |
927.33 |
1150.68 |
1436.43 |
1652.04 |
1513.65 |
938.56 |
535.19 |
470.95 |
953.25 |
1023.75 |
778.2 |
622.75 |
| |
|
|
|
|
|
|
|
|
|
|
|
|
|
| | Jan | Feb | Mar | Apr | May | Jun | Jul | Aug | Sep | Oct | Nov | Dec | Avg Annual |
Click here for this table in tab-delimited format.
Tab-delimited format will open in most table browsing software, i.e. Excel, etc.
View this station on the map.
Return to start.