Results
| Country: | U.S.A.
| | Station: | GreenIsland, N.Y. | | River: | Hudson | | Area: | 20953 km2 | | Lat: | 42.75 | | Lon: | -73.68 | | Source: | RivDIS | | PointID: | 1052 | | Area Units: | km2 | | Discharge Units: | m3/sec | | Starting Year: | 1946 | | Ending Year: | 1984 | | Total Years: | 39 | | Total Usable Years: | 38 | |
| |
| Year | Jan | Feb | Mar | Apr | May | Jun | Jul | Aug | Sep | Oct | Nov | Dec | Avg Annual |
|---|
| 1946 | -9999 | -9999 | 913 | 301 | 517 | 447 | 178 | 159 | 136 | 210 | 217 | 253 | -9999 |
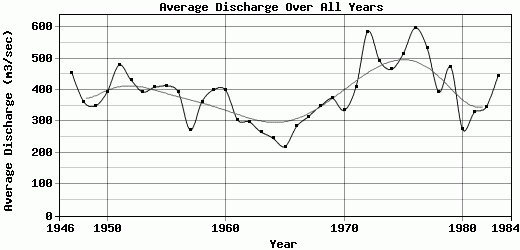
| 1947 | 426 | 445 | 595 | 975 | 1009 | 753 | 353 | 210 | 144 | 134 | 204 | 217 | 455.42 |
| 1948 | 165 | 299 | 1024 | 732 | 555 | 346 | 201 | 167 | 109 | 120 | 246 | 394 | 363.17 |
| 1949 | 959 | 620 | 537 | 488 | 282 | 131 | 103 | 110 | 145 | 161 | 242 | 417 | 349.58 |
| 1950 | 659 | 383 | 624 | 852 | 402 | 227 | 140 | 145 | 270 | 158 | 318 | 563 | 395.08 |
| 1951 | 462 | 676 | 656 | 1143 | 316 | 212 | 381 | 240 | 230 | 287 | 582 | 574 | 479.92 |
| 1952 | 705 | 504 | 592 | 1172 | 621 | 407 | 201 | 150 | 145 | 127 | 136 | 420 | 431.67 |
| 1953 | 434 | 517 | 856 | 807 | 933 | 173 | 115 | 140 | 122 | 132 | 144 | 349 | 393.5 |
| 1954 | 271 | 614 | 523 | 897 | 726 | 404 | 139 | 122 | 180 | 141 | 410 | 477 | 408.67 |
| 1955 | 322 | 337 | 765 | 1077 | 274 | 235 | 127 | 182 | 139 | 564 | 602 | 334 | 413.17 |
| 1956 | 281 | 237 | 527 | 1230 | 665 | 372 | 177 | 134 | 226 | 200 | 238 | 424 | 392.58 |
| 1957 | 348 | 321 | 440 | 445 | 284 | 151 | 176 | 139 | 113 | 133 | 193 | 526 | 272.42 |
| 1958 | 385 | 293 | 528 | 1072 | 446 | 264 | 159 | 150 | 184 | 273 | 341 | 268 | 363.58 |
| 1959 | 379 | 346 | 545 | 1015 | 338 | 177 | 120 | 107 | 113 | 277 | 647 | 751 | 401.25 |
| 1960 | 472 | 526 | 358 | 1461 | 405 | 300 | 185 | 166 | 311 | 190 | 215 | 196 | 398.75 |
| 1961 | 118 | 369 | 553 | 656 | 493 | 371 | 214 | 175 | 162 | 128 | 189 | 229 | 304.75 |
| 1962 | 291 | 208 | 488 | 985 | 417 | 136 | 96 | 134 | 108 | 183 | 263 | 277 | 298.83 |
| 1963 | 194 | 177 | 531 | 887 | 419 | 172 | 111 | 130 | 105 | 102 | 155 | 205 | 265.67 |
| 1964 | 271 | 207 | 763 | 729 | 267 | 108 | 88 | 93 | 81 | 84 | 92 | 172 | 246.25 |
| 1965 | 150 | 258 | 258 | 546 | 235 | 101 | 87 | 82 | 113 | 207 | 302 | 301 | 220 |
| 1966 | 230 | 329 | 654 | 443 | 521 | 234 | 104 | 120 | 159 | 166 | 199 | 258 | 284.75 |
| 1967 | 272 | 216 | 322 | 876 | 483 | 175 | 144 | 163 | 140 | 197 | 332 | 467 | 315.58 |
| 1968 | 248 | 266 | 696 | 512 | 517 | 440 | 274 | 124 | 125 | 145 | 403 | 436 | 348.83 |
| 1969 | 327 | 357 | 489 | 1140 | 585 | 280 | 152 | 170 | 116 | 136 | 399 | 330 | 373.42 |
| 1970 | 229 | 429 | 421 | 1100 | 407 | 179 | 167 | 109 | 173 | 229 | 261 | 319 | 335.25 |
| 1971 | 252 | 339 | 500 | 1045 | 987 | 205 | 174 | 250 | 261 | 219 | 204 | 476 | 409.33 |
| 1972 | 375 | 306 | 752 | 1060 | 1135 | 829 | 514 | 213 | 177 | 201 | 725 | 754 | 586.75 |
| 1973 | 742 | 579 | 833 | 877 | 782 | 370 | 294 | 158 | 136 | 160 | 234 | 748 | 492.75 |
| 1974 | 623 | 528 | 587 | 854 | 650 | 249 | 334 | 180 | 294 | 256 | 487 | 549 | 465.92 |
| 1975 | 540 | 549 | 671 | 724 | 566 | 367 | 211 | 254 | 482 | 663 | 637 | 532 | 516.33 |
| 1976 | 413 | 876 | 887 | 1030 | 891 | 426 | 428 | 410 | 268 | 651 | 502 | 394 | 598 |
| 1977 | 223 | 225 | 1220 | 1140 | 449 | 205 | 161 | 152 | 403 | 844 | 656 | 741 | 534.92 |
| 1978 | 737 | 395 | 612 | 940 | 524 | 279 | 130 | 167 | 173 | 241 | 225 | 300 | 393.58 |
| 1979 | 565 | 332 | 1240 | 1070 | 548 | 233 | 130 | 147 | 218 | 310 | 460 | 425 | 473.17 |
| 1980 | 256 | 128 | 633 | 748 | 274 | 192 | 144 | 130 | 118 | 158 | 242 | 273 | 274.67 |
| 1981 | 148 | 851 | 349 | 384 | 328 | 169 | 140 | 134 | 273 | 456 | 395 | 321 | 329 |
| 1982 | 321 | 361 | 620 | 1084 | 354 | 431 | 182 | 124 | 122 | 124 | 196 | 233 | 346 |
| 1983 | 259 | 352 | 580 | 1062 | 1036 | 358 | 127 | 155 | 133 | 154 | 339 | 799 | 446.17 |
| 1984 | 308 | 741 | 465 | 939 | 844 | 417 | 289 | 176 | 190 | -9999 | -9999 | -9999 | -9999 |
| |
|
|
|
|
|
|
|
|
|
|
|
|
|
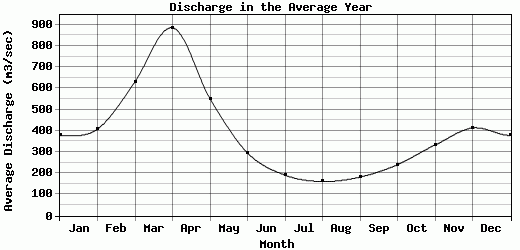
| Avg | 377.89 | 407.79 | 630.95 | 884.56 | 550.9 | 295.51 | 191.03 | 160.79 | 181.97 | 240.03 | 332.42 | 413.21 | 388.61 |
| |
|
|
|
|
|
|
|
|
|
|
|
|
|
| Std Dev | 190.31 |
179.12 |
214.45 |
259.05 |
239.46 |
154.37 |
97.07 |
55.98 |
84.57 |
169.12 |
165.34 |
172.25 |
89.88 |
| |
|
|
|
|
|
|
|
|
|
|
|
|
|
| | Jan | Feb | Mar | Apr | May | Jun | Jul | Aug | Sep | Oct | Nov | Dec | Avg Annual |
Click here for this table in tab-delimited format.
Tab-delimited format will open in most table browsing software, i.e. Excel, etc.
View this station on the map.
Return to start.