Results
| Country: | Brazil
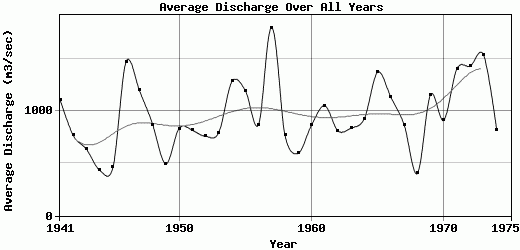
| | Station: | SaltoOsorio | | River: | Iguacu | | Area: | 46400 km2 | | Lat: | -25.55 | | Lon: | -53.05 | | Source: | RivDIS | | PointID: | 517 | | Area Units: | km2 | | Discharge Units: | m3/sec | | Starting Year: | 1941 | | Ending Year: | 1975 | | Total Years: | 35 | | Total Usable Years: | 34 | |
| |
| Year | Jan | Feb | Mar | Apr | May | Jun | Jul | Aug | Sep | Oct | Nov | Dec | Avg Annual |
|---|
| 1941 | 1089 | 1825 | 836 | 622 | 1083 | 1063 | 710 | 1832 | 915 | 991 | 1222 | 1150 | 1111.5 |
| 1942 | 703 | 1454 | 1093 | 1372 | 643 | 807 | 768 | 522 | 519 | 665 | 392 | 285 | 768.58 |
| 1943 | 322 | 534 | 425 | 265 | 216 | 959 | 691 | 977 | 908 | 1115 | 802 | 420 | 636.17 |
| 1944 | 688 | 423 | 1054 | 462 | 209 | 172 | 158 | 139 | 382 | 212 | 690 | 625 | 434.5 |
| 1945 | 200 | 374 | 636 | 280 | 188 | 327 | 1293 | 409 | 350 | 519 | 472 | 477 | 460.42 |
| 1946 | 931 | 3400 | 2478 | 989 | 749 | 1124 | 2196 | 825 | 812 | 1754 | 1130 | 1300 | 1474 |
| 1947 | 954 | 1404 | 1104 | 619 | 446 | 1215 | 861 | 1276 | 2524 | 2201 | 833 | 953 | 1199.17 |
| 1948 | 745 | 1015 | 917 | 707 | 973 | 775 | 535 | 1624 | 671 | 899 | 1238 | 367 | 872.17 |
| 1949 | 372 | 209 | 463 | 943 | 767 | 946 | 417 | 368 | 426 | 465 | 311 | 259 | 495.5 |
| 1950 | 975 | 908 | 1458 | 540 | 649 | 447 | 539 | 310 | 437 | 2176 | 903 | 663 | 833.75 |
| 1951 | 760 | 1503 | 1852 | 564 | 287 | 268 | 334 | 170 | 163 | 1373 | 1485 | 1055 | 817.83 |
| 1952 | 485 | 444 | 304 | 322 | 154 | 764 | 510 | 323 | 1235 | 2387 | 1538 | 644 | 759.17 |
| 1953 | 633 | 701 | 553 | 548 | 423 | 526 | 336 | 236 | 1031 | 1573 | 2123 | 859 | 795.17 |
| 1954 | 1471 | 806 | 914 | 599 | 2980 | 2364 | 1290 | 674 | 1018 | 1941 | 846 | 522 | 1285.42 |
| 1955 | 456 | 347 | 509 | 807 | 1485 | 3381 | 3465 | 1405 | 1273 | 469 | 347 | 426 | 1197.5 |
| 1956 | 587 | 823 | 440 | 1375 | 1817 | 993 | 820 | 1330 | 1005 | 666 | 350 | 218 | 868.67 |
| 1957 | 434 | 1117 | 551 | 437 | 424 | 1028 | 3009 | 4972 | 5379 | 1904 | 1494 | 820 | 1797.42 |
| 1958 | 540 | 344 | 797 | 491 | 259 | 517 | 489 | 880 | 1955 | 1041 | 935 | 977 | 768.75 |
| 1959 | 723 | 1023 | 521 | 478 | 604 | 754 | 474 | 589 | 866 | 558 | 335 | 238 | 596.92 |
| 1960 | 274 | 503 | 416 | 543 | 491 | 698 | 500 | 1392 | 1449 | 1455 | 1702 | 950 | 864.42 |
| 1961 | 581 | 514 | 1769 | 983 | 925 | 869 | 499 | 259 | 1281 | 1681 | 2237 | 1032 | 1052.5 |
| 1962 | 638 | 1060 | 1243 | 556 | 354 | 515 | 374 | 271 | 1053 | 2214 | 982 | 478 | 811.5 |
| 1963 | 580 | 1136 | 923 | 841 | 332 | 281 | 175 | 160 | 195 | 1700 | 2752 | 980 | 837.92 |
| 1964 | 458 | 654 | 518 | 970 | 971 | 938 | 1077 | 1625 | 1510 | 946 | 587 | 897 | 929.25 |
| 1965 | 487 | 763 | 758 | 480 | 2469 | 890 | 2152 | 1113 | 1092 | 2508 | 1745 | 2015 | 1372.67 |
| 1966 | 1177 | 2244 | 1423 | 547 | 431 | 639 | 946 | 470 | 1149 | 1741 | 1473 | 1353 | 1132.75 |
| 1967 | 1605 | 1187 | 1596 | 780 | 335 | 775 | 595 | 608 | 763 | 545 | 674 | 981 | 870.33 |
| 1968 | 593 | 549 | 327 | 390 | 322 | 243 | 284 | 216 | 222 | 407 | 753 | 542 | 404 |
| 1969 | 1298 | 844 | 818 | 1736 | 1041 | 2141 | 1491 | 569 | 542 | 1333 | 1331 | 771 | 1159.58 |
| 1970 | 735 | 625 | 518 | 460 | 650 | 1591 | 2146 | 544 | 692 | 1299 | 562 | 1155 | 914.75 |
| 1971 | 3420 | 1207 | 1162 | 1239 | 2026 | 2584 | 1838 | 820 | 752 | 1000 | 439 | 401 | 1407.33 |
| 1972 | 680 | 1403 | 1250 | 859 | 335 | 841 | 1070 | 1950 | 3556 | 2917 | 1159 | 1171 | 1432.58 |
| 1973 | 1405 | 1357 | 898 | 722 | 1329 | 1751 | 1901 | 1799 | 2875 | 2396 | 1346 | 689 | 1539 |
| 1974 | 1160 | 1207 | 1114 | 613 | 384 | 763 | 977 | 751 | 1075 | 513 | 664 | 591 | 817.67 |
| 1975 | 794 | 787 | 771 | 480 | 351 | -9999 | 431 | 913 | 1398 | 2995 | 1261 | -9999 | -9999 |
| |
|
|
|
|
|
|
|
|
|
|
|
|
|
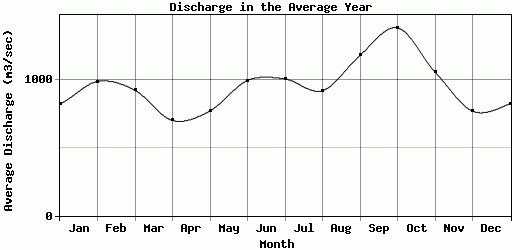
| Avg | 827.23 | 991.26 | 925.97 | 703.4 | 774.34 | 998.5 | 1010.03 | 923.46 | 1184.94 | 1387.4 | 1060.37 | 772.47 | 962.32 |
| |
|
|
|
|
|
|
|
|
|
|
|
|
|
| Std Dev | 559.33 |
610.11 |
482.85 |
328.37 |
660.27 |
700.4 |
794.95 |
873.05 |
1019.34 |
758.95 |
580.43 |
383.21 |
333.1 |
| |
|
|
|
|
|
|
|
|
|
|
|
|
|
| | Jan | Feb | Mar | Apr | May | Jun | Jul | Aug | Sep | Oct | Nov | Dec | Avg Annual |
Click here for this table in tab-delimited format.
Tab-delimited format will open in most table browsing software, i.e. Excel, etc.
View this station on the map.
Return to start.