Results
| Country: | Madagascar
| | Station: | Antsatrana | | River: | Ikopa | | Area: | 18550 km2 | | Lat: | -17.41 | | Lon: | 46.85 | | Source: | RivDIS | | PointID: | 57 | | Area Units: | km2 | | Discharge Units: | m3/sec | | Starting Year: | 1965 | | Ending Year: | 1999 | | Total Years: | 35 | | Total Usable Years: | 32 | |
| |
| Year | Jan | Feb | Mar | Apr | May | Jun | Jul | Aug | Sep | Oct | Nov | Dec | Avg Annual |
|---|
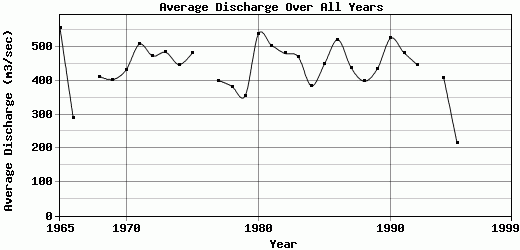
| 1965 | 1388 | 1249 | 909 | 661 | 354 | 295 | 271 | 239 | 165 | 134 | 246 | 776 | 557.25 |
| 1966 | 560 | 815 | 431 | 308 | 234 | 181 | 153 | 145 | 116 | 102 | 110 | 325 | 290 |
| 1967 | 1147 | 669 | 1290 | 535 | 277 | 217 | 181 | 141 | 119 | 105 | -9999 | -9999 | -9999 |
| 1968 | 622 | 987 | 925 | 404 | 237 | 208 | 177 | 148 | 112 | 99 | 297 | 737 | 412.75 |
| 1969 | 789 | 972 | 560 | 554 | 292 | 199 | 170 | 149 | 117 | 120 | 181 | 744 | 403.92 |
| 1970 | 1327 | 752 | 905 | 381 | 248 | 137 | 166 | 137 | 104 | 92 | 405 | 536 | 432.5 |
| 1971 | 999 | 1571 | 967 | 452 | 295 | 242 | 180 | 131 | 127 | 109 | 328 | 701 | 508.5 |
| 1972 | 556 | 1670 | 900 | 474 | 297 | 236 | 193 | 167 | 105 | 222 | 268 | 596 | 473.67 |
| 1973 | 988 | 1099 | 1060 | 521 | 276 | 246 | 186 | 162 | 131 | 104 | 510 | 533 | 484.67 |
| 1974 | 715 | 910 | 735 | 831 | 353 | 227 | 195 | 163 | 123 | 150 | 247 | 729 | 448.17 |
| 1975 | 796 | 1156 | 1111 | 555 | 310 | 239 | 197 | 164 | 120 | 142 | 471 | 530 | 482.58 |
| 1976 | -9999 | -9999 | -9999 | -9999 | -9999 | -9999 | -9999 | -9999 | -9999 | -9999 | 194 | 373 | -9999 |
| 1977 | 955 | 1040 | 854 | 405 | 289 | 168 | 147 | 118 | 97.5 | 97.5 | 136 | 498 | 400.42 |
| 1978 | 900 | 901 | 860 | 470 | 159 | 110 | 114 | 163 | 114 | 100 | 167 | 540 | 383.17 |
| 1979 | 1124 | 627 | 102 | 556 | 341 | 229 | 182 | 148 | 121 | 105 | 298 | 441 | 356.17 |
| 1980 | 1000 | 1314 | 1083 | 672 | 401 | 341 | 210 | 179 | 134 | 111 | 323 | 708 | 539.67 |
| 1981 | 750 | 900 | 1682 | 689 | 411 | 288 | 235 | 176 | 140 | 112 | 176 | 500 | 504.92 |
| 1982 | 980 | 1000 | 1314 | 520 | 365 | 272 | 211 | 161 | 115 | 110 | 153 | 580 | 481.75 |
| 1983 | 910 | 1037 | 1396 | 576 | 261 | 189 | 156 | 139 | 107 | 98 | 145 | 640 | 471.17 |
| 1984 | 880 | 1260 | 462 | 480 | 184 | 148 | 183 | 123 | 100 | 87 | 155 | 560 | 385.17 |
| 1985 | 666 | 1137 | 1357 | 661 | 279 | 221 | 194 | 136 | 104 | 107 | 149 | 400 | 450.92 |
| 1986 | 1184 | 795 | 1406 | 764 | 367 | 269 | 229 | 178 | 123 | 102 | 377 | 472 | 522.17 |
| 1987 | 964 | 882 | 1037 | 402 | 240 | 220 | 174 | 140 | 161 | 160 | 252 | 633 | 438.75 |
| 1988 | 1053 | 828 | 944 | 373 | 235 | 190 | 153 | 126 | 101 | 87 | 81 | 617 | 399 |
| 1989 | 1082 | 337 | 722 | 553 | 271 | 165 | 152 | 124 | 93 | 91 | 114 | 1536 | 436.67 |
| 1990 | 934 | 997 | 1174 | 708 | 368 | 249 | 192 | 158 | 127 | 118 | 581 | 716 | 526.83 |
| 1991 | 815 | 1324 | 778 | 543 | 306 | 284 | 218 | 180 | 132 | 145 | 336 | 731 | 482.67 |
| 1992 | 681 | 1281 | 833 | 380 | 237 | 217 | 220 | 173 | 120 | 100 | 239 | 890 | 447.58 |
| 1993 | -9999 | 817 | 513 | 497 | 269 | 194 | 173 | 145 | 104 | 105 | 227 | 622 | -9999 |
| 1994 | 578 | 1308 | 1117 | 440 | 245 | 199 | 153 | 130 | 94.8 | 155 | 187 | 297 | 408.65 |
| 1995 | 730 | 113 | 381 | 218 | 109 | 113 | 110 | 85 | 81 | 82 | 138 | 429 | 215.75 |
| 1996 | 483 | 1030 | 496 | 371 | 157 | -9999 | -9999 | -9999 | -9999 | -9999 | 446 | 567 | -9999 |
| 1997 | 803 | 516 | 785 | 549 | 205 | 142 | 134 | 113 | 0 | 119 | 115 | -9999 | -9999 |
| 1998 | -9999 | -9999 | -9999 | -9999 | 242 | -9999 | -9999 | -9999 | 89.1 | -9999 | 236 | 451 | -9999 |
| 1999 | 1545 | 1815 | 1088 | 537 | 286 | 207 | 187 | 151 | -9999 | 131 | -9999 | -9999 | -9999 |
| |
|
|
|
|
|
|
|
|
|
|
|
|
|
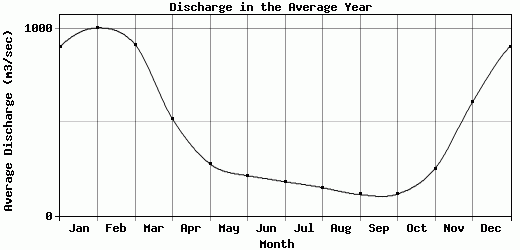
| Avg | 903.25 | 1003.3 | 914.45 | 516.36 | 276.47 | 213.81 | 181.13 | 149.75 | 112.42 | 115.67 | 251.15 | 606.5 | 440.91 |
| |
|
|
|
|
|
|
|
|
|
|
|
|
|
| Std Dev | 246.49 |
346.21 |
337.9 |
131.38 |
68.25 |
52.54 |
33.58 |
26.74 |
27.19 |
27.7 |
123.5 |
216.11 |
72.94 |
| |
|
|
|
|
|
|
|
|
|
|
|
|
|
| | Jan | Feb | Mar | Apr | May | Jun | Jul | Aug | Sep | Oct | Nov | Dec | Avg Annual |
Click here for this table in tab-delimited format.
Tab-delimited format will open in most table browsing software, i.e. Excel, etc.
View this station on the map.
Return to start.