Results
| Country: | U.S.A.
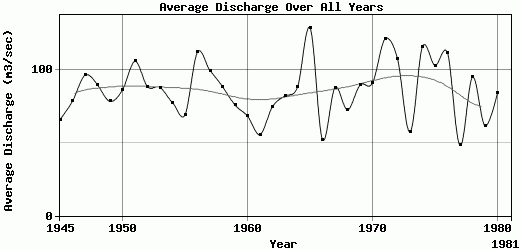
| | Station: | HENRY, IL | | River: | ILLINOIS RIVER | | Area: | 35074.29 | | Lat: | 41.11 | | Lon: | -89.35 | | Source: | USGS | | PointID: | 5558300 | | Area Units: | km2 | | Discharge Units: | m3/sec | | Starting Year: | 1945 | | Ending Year: | 1981 | | Total Years: | 37 | | Total Usable Years: | 36 | |
| |
| Year | Jan | Feb | Mar | Apr | May | Jun | Jul | Aug | Sep | Oct | Nov | Dec | Avg Annual |
|---|
| 1945 | 47.73 | 47.86 | 44.61 | 46.39 | 118.1 | 172.91 | 99.64 | 42.22 | 36.45 | 42.6 | 50.07 | 44.47 | 66.09 |
| 1946 | 45.33 | 44.5 | 47.14 | 88.44 | 170.38 | 176.07 | 87.19 | 41.75 | 55.67 | 69.97 | 61.5 | 55.69 | 78.64 |
| 1947 | 43.66 | 45.07 | 58.65 | 89.5 | 299.83 | 228.37 | 112.38 | 51.07 | 51.04 | 65.49 | 62.59 | 50.43 | 96.51 |
| 1948 | 45.82 | 44.99 | 44.06 | 64.87 | 195.61 | 314.72 | 112.84 | 52.37 | 42.9 | 57 | 57.09 | 46.58 | 89.9 |
| 1949 | 43.22 | 47.73 | 56.73 | 85.4 | 225.64 | 187.34 | 68.68 | 38.93 | 39.15 | 51.2 | 53.65 | 46.39 | 78.67 |
| 1950 | 36.45 | 47.77 | 47.76 | 60.79 | 127.65 | 269.97 | 146.86 | 57.56 | 57.46 | 63 | 65.6 | 54.94 | 86.32 |
| 1951 | 46.32 | 54.21 | 54.49 | 116.06 | 271.24 | 267.44 | 152.56 | 80.76 | 52.99 | 64.03 | 61.28 | 51.95 | 106.11 |
| 1952 | 50.41 | 47.46 | 47.44 | 94.7 | 246.41 | 242.43 | 103 | 49.3 | 39.85 | 47.18 | 49.71 | 46.4 | 88.69 |
| 1953 | 53.08 | 46.2 | 46.51 | 61.49 | 115.94 | 319.26 | 163.01 | 55.14 | 43.24 | 48.04 | 55.75 | 50.14 | 88.15 |
| 1954 | 48.09 | 46.99 | 46.37 | 65.09 | 191.3 | 180.29 | 128.7 | 48.87 | 39.9 | 45.71 | 49.34 | 41.98 | 77.72 |
| 1955 | 44.9 | 42.37 | 42.25 | 42.92 | 97 | 213.41 | 109.67 | 40.37 | 36.69 | 44.95 | 54.84 | 62.65 | 69.33 |
| 1956 | 51.98 | 43.48 | 67.78 | 113.83 | 314.19 | 358.46 | 123.53 | 60.61 | 49.12 | 59.82 | 57.46 | 49.46 | 112.48 |
| 1957 | 43.07 | 50.76 | 52.39 | 56.63 | 274.32 | 338.91 | 115.52 | 47.19 | 46.87 | 60.49 | 58.13 | 53.48 | 99.81 |
| 1958 | 46.92 | 55.79 | 48.15 | 56.87 | 277.2 | 238.55 | 86.24 | 49.34 | 42.23 | 49.43 | 57.48 | 56.26 | 88.71 |
| 1959 | 49.06 | 46.7 | 46.58 | 66.26 | 101.53 | 240.02 | 86.84 | 41.72 | 51.2 | 69.83 | 63.14 | 50.54 | 76.12 |
| 1960 | 48.6 | 48.39 | 61.91 | 83.92 | 122.97 | 189.1 | 55.49 | 36.13 | 36.55 | 43.01 | 50.46 | 45.22 | 68.48 |
| 1961 | 42.58 | 47.38 | 41.23 | 39.5 | 100.07 | 155.05 | 41.83 | 25.43 | 42.1 | 44.49 | 45.47 | 43.96 | 55.76 |
| 1962 | 44.28 | 47.58 | 46.3 | 78.33 | 122.7 | 222.7 | 89.1 | 46.82 | 35.35 | 60.32 | 56.64 | 49.4 | 74.96 |
| 1963 | 39.89 | 66.6 | 43.96 | 51.16 | 159.72 | 270.52 | 104.06 | 46.18 | 51.44 | 52.79 | 57.12 | 45.06 | 82.37 |
| 1964 | 39.21 | 42.73 | 43.56 | 56.44 | 152.34 | 317.47 | 133.84 | 52.49 | 45.76 | 51.59 | 55.49 | 68.59 | 88.29 |
| 1965 | 53.68 | 51.85 | 50.08 | 96.37 | 222.04 | 469.21 | 234.59 | 99.49 | 79.43 | 67.38 | 65.07 | 60.48 | 129.14 |
| 1966 | 55.56 | 51.22 | 48.54 | 60.46 | 97.16 | 94.78 | 39.25 | 23.27 | 30.02 | 39.92 | 45.07 | 42.38 | 52.3 |
| 1967 | 43.27 | 40.02 | 39.84 | 41.75 | 160.85 | 338.65 | 135.68 | 43.57 | 38.24 | 65.55 | 59.98 | 49 | 88.03 |
| 1968 | 45.36 | 49.09 | 48.6 | 53.02 | 105.3 | 216.11 | 79.19 | 53.52 | 52.08 | 61.69 | 58.96 | 50.28 | 72.77 |
| 1969 | 53.98 | 44.97 | 52.61 | 123.54 | 263.32 | 212.46 | 90.93 | 40.78 | 40.72 | 55.94 | 50.24 | 47.51 | 89.75 |
| 1970 | 50.62 | 43.9 | 42.51 | 42.08 | 159.32 | 330.5 | 148.7 | 48.32 | 54.34 | 58.11 | 61.73 | 53.1 | 91.1 |
| 1971 | 60.08 | 57.6 | 49.76 | 68.93 | 272.75 | 441.46 | 184.7 | 71.6 | 55.64 | 67.64 | 63.85 | 62.81 | 121.4 |
| 1972 | 63.41 | 66.87 | 77.66 | 63.37 | 188.22 | 420.42 | 129.45 | 60.2 | 52.06 | 62.45 | 58.61 | 50.91 | 107.8 |
| 1973 | 48.3 | 46.29 | 46.44 | 51.38 | 103.78 | 114.13 | 53.4 | 29.88 | 39.68 | 45.62 | 61.56 | 50.18 | 57.55 |
| 1974 | 66.05 | 47.96 | 56.3 | 87.32 | 202.37 | 475.44 | 172.55 | 71.2 | 47.78 | 58.29 | 59.87 | 50.74 | 116.32 |
| 1975 | 48.62 | 47.67 | 47.34 | 47.87 | 102.75 | 366.59 | 252.3 | 75.57 | 51.65 | 68.88 | 66.73 | 63.54 | 103.29 |
| 1976 | 55.37 | 54.69 | 56.98 | 105.48 | 325.17 | 289.48 | 122.47 | 75.85 | 70.41 | 69.92 | 62.42 | 52.58 | 111.74 |
| 1977 | 48.57 | 50.76 | 45.38 | 41.93 | 46.79 | 89.18 | 44.41 | 28.88 | 35.94 | 47.94 | 47.83 | 52.28 | 48.32 |
| 1978 | 49.5 | 44.21 | 72.95 | 94.72 | 156.18 | 282.65 | 157.73 | 59.75 | 63.42 | 55.77 | 57.01 | 47.76 | 95.14 |
| 1979 | 47.51 | 51.43 | 54.72 | 58.06 | 143.6 | 132.63 | 52.41 | 35.22 | 29.88 | 42.66 | 47.88 | 46 | 61.83 |
| 1980 | 41.97 | 51.71 | 42.53 | 67.17 | 212.92 | 215.76 | 112.9 | 44.14 | 53.73 | 52.64 | 60.49 | 55.78 | 84.31 |
| 1981 | -9999 | -9999 | -9999 | -9999 | -9999 | -9999 | -9999 | -9999 | -9999 | -9999 | -9999 | -9999 | -9999 |
| |
|
|
|
|
|
|
|
|
|
|
|
|
|
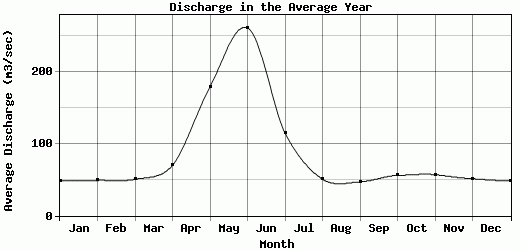
| Avg | 48.4 | 49.02 | 50.56 | 70.06 | 179.07 | 260.9 | 114.77 | 50.71 | 46.97 | 55.87 | 56.95 | 51.36 | 86.22 |
| |
|
|
|
|
|
|
|
|
|
|
|
|
|
| Std Dev | 6.28 |
5.75 |
8.52 |
22.8 |
72.36 |
98.16 |
48.67 |
16.01 |
10.51 |
9.14 |
5.79 |
6.17 |
19.35 |
| |
|
|
|
|
|
|
|
|
|
|
|
|
|
| | Jan | Feb | Mar | Apr | May | Jun | Jul | Aug | Sep | Oct | Nov | Dec | Avg Annual |
Click here for this table in tab-delimited format.
Tab-delimited format will open in most table browsing software, i.e. Excel, etc.
View this station on the map.
Return to start.