Results
| Country: | U.S.A.
| | Station: | VALLEY CITY | | River: | ILLINOIS RIVER | | Area: | 69262.85 | | Lat: | 39.7 | | Lon: | -90.64 | | Source: | USGS | | PointID: | 5586100 | | Area Units: | km2 | | Discharge Units: | m3/sec | | Starting Year: | 1945 | | Ending Year: | 1956 | | Total Years: | 12 | | Total Usable Years: | 11 | |
| |
| Year | Jan | Feb | Mar | Apr | May | Jun | Jul | Aug | Sep | Oct | Nov | Dec | Avg Annual |
|---|
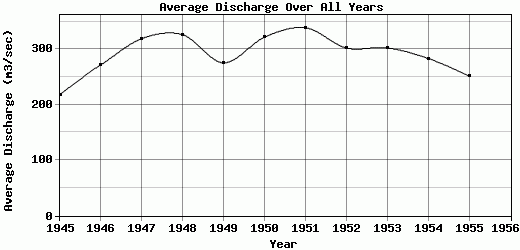
| 1945 | 89.55 | 96.64 | 92.15 | 125.39 | 562 | 814.11 | 298.13 | 123.25 | 100.57 | 102.89 | 116.99 | 96.73 | 218.2 |
| 1946 | 98.36 | 95.78 | 127.08 | 374.78 | 895.09 | 692.73 | 250.61 | 121.34 | 136.71 | 162.63 | 151.42 | 154.4 | 271.74 |
| 1947 | 106.02 | 123.42 | 167.1 | 322.41 | 1288.88 | 837.14 | 307.18 | 141.12 | 125.12 | 148.46 | 136.91 | 121.43 | 318.77 |
| 1948 | 119.88 | 106.54 | 102.94 | 225.54 | 976.64 | 1399.14 | 363.25 | 156.67 | 110.51 | 127.01 | 123.22 | 99.21 | 325.88 |
| 1949 | 91.44 | 101.03 | 142.3 | 345.76 | 1153.14 | 720.95 | 209.37 | 108.17 | 95.21 | 111.73 | 118.93 | 107.15 | 275.43 |
| 1950 | 96.2 | 115.41 | 124.9 | 226.98 | 641.07 | 1298.71 | 564.76 | 174.77 | 132.01 | 157.73 | 180.11 | 144.46 | 321.43 |
| 1951 | 114.22 | 144.94 | 131.89 | 448.44 | 1119.62 | 955.32 | 435.62 | 189.59 | 126.37 | 150.33 | 127.8 | 115.41 | 338.3 |
| 1952 | 101.48 | 98.85 | 107.99 | 391.1 | 1104.64 | 956.17 | 326.52 | 143.2 | 102.98 | 101.86 | 98.1 | 91.76 | 302.05 |
| 1953 | 115.2 | 104.48 | 111 | 239.89 | 563.97 | 1316.08 | 564.06 | 165.3 | 113.01 | 108 | 118.83 | 106.19 | 302.17 |
| 1954 | 98.08 | 109.7 | 117.89 | 284.95 | 975.75 | 802.79 | 436.03 | 157.81 | 109.47 | 109.39 | 110.43 | 85.29 | 283.13 |
| 1955 | 89.87 | 85.72 | 91.21 | 122.09 | 496.11 | 1075.95 | 403.2 | 136.84 | 104.67 | 115.4 | 131.08 | 168.46 | 251.72 |
| 1956 | -9999 | -9999 | -9999 | -9999 | -9999 | -9999 | -9999 | -9999 | -9999 | -9999 | -9999 | -9999 | -9999 |
| |
|
|
|
|
|
|
|
|
|
|
|
|
|
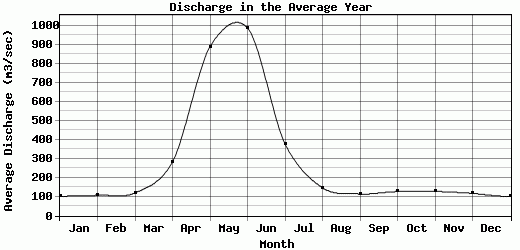
| Avg | 101.85 | 107.5 | 119.68 | 282.48 | 888.81 | 988.1 | 378.07 | 147.1 | 114.24 | 126.86 | 128.53 | 117.32 | 291.71 |
| |
|
|
|
|
|
|
|
|
|
|
|
|
|
| Std Dev | 10.16 |
15.31 |
21.44 |
100.91 |
265.09 |
239.09 |
111.09 |
23.38 |
13.11 |
22.3 |
21.03 |
25.95 |
34.26 |
| |
|
|
|
|
|
|
|
|
|
|
|
|
|
| | Jan | Feb | Mar | Apr | May | Jun | Jul | Aug | Sep | Oct | Nov | Dec | Avg Annual |
Click here for this table in tab-delimited format.
Tab-delimited format will open in most table browsing software, i.e. Excel, etc.
View this station on the map.
Return to start.