Results
| Country: | Austria
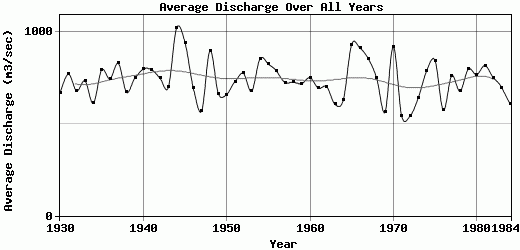
| | Station: | Scharding | | River: | Inn | | Area: | 25665 km2 | | Lat: | 48.45 | | Lon: | 13.43 | | Source: | RivDIS | | PointID: | 203 | | Area Units: | km2 | | Discharge Units: | m3/sec | | Starting Year: | 1930 | | Ending Year: | 1984 | | Total Years: | 55 | | Total Usable Years: | 55 | |
| |
| Year | Jan | Feb | Mar | Apr | May | Jun | Jul | Aug | Sep | Oct | Nov | Dec | Avg Annual |
|---|
| 1930 | 299 | 189 | 265 | 427 | 910 | 1139 | 830 | 1295 | 803 | 721 | 699 | 390 | 663.92 |
| 1931 | 331 | 284 | 431 | 588 | 1002 | 1378 | 1303 | 1244 | 1022 | 726 | 492 | 425 | 768.83 |
| 1932 | 579 | 310 | 311 | 529 | 1002 | 963 | 1299 | 1063 | 701 | 529 | 483 | 355 | 677 |
| 1933 | 240 | 464 | 366 | 518 | 980 | 1158 | 1478 | 1233 | 752 | 730 | 535 | 330 | 732 |
| 1934 | 294 | 278 | 420 | 579 | 715 | 866 | 1079 | 1107 | 828 | 484 | 365 | 294 | 609.08 |
| 1935 | 263 | 514 | 469 | 877 | 1116 | 1762 | 1283 | 835 | 660 | 730 | 588 | 396 | 791.08 |
| 1936 | 452 | 477 | 386 | 579 | 846 | 1279 | 1312 | 1094 | 794 | 666 | 589 | 438 | 742.67 |
| 1937 | 350 | 500 | 572 | 773 | 1250 | 1481 | 1050 | 1155 | 1130 | 843 | 451 | 364 | 826.58 |
| 1938 | 403 | 336 | 494 | 585 | 793 | 1381 | 1127 | 971 | 868 | 435 | 364 | 274 | 669.25 |
| 1939 | 265 | 349 | 432 | 751 | 778 | 1257 | 1176 | 978 | 734 | 770 | 746 | 737 | 747.75 |
| 1940 | 328 | 316 | 769 | 759 | 1054 | 1630 | 1321 | 955 | 901 | 624 | 546 | 344 | 795.58 |
| 1941 | 405 | 365 | 481 | 579 | 729 | 1139 | 1296 | 1387 | 1166 | 820 | 723 | 414 | 792 |
| 1942 | 360 | 354 | 717 | 608 | 1032 | 1260 | 1095 | 1082 | 738 | 709 | 577 | 421 | 746.08 |
| 1943 | 310 | 356 | 409 | 808 | 920 | 1638 | 1322 | 871 | 693 | 457 | 280 | 295 | 696.58 |
| 1944 | 438 | 446 | 404 | 1413 | 1427 | 1773 | 1604 | 1345 | 907 | 778 | 965 | 735 | 1019.58 |
| 1945 | 397 | 834 | 831 | 1241 | 1793 | 1686 | 1177 | 987 | 666 | 785 | 479 | 398 | 939.5 |
| 1946 | 382 | 518 | 538 | 804 | 772 | 1059 | 1504 | 963 | 722 | 396 | 353 | 293 | 692 |
| 1947 | 265 | 199 | 645 | 631 | 826 | 848 | 1088 | 689 | 372 | 242 | 508 | 510 | 568.58 |
| 1948 | 760 | 674 | 847 | 839 | 1230 | 1383 | 1815 | 1502 | 765 | 412 | 302 | 220 | 895.75 |
| 1949 | 252 | 243 | 344 | 896 | 1057 | 1103 | 881 | 1229 | 769 | 359 | 333 | 491 | 663.08 |
| 1950 | 446 | 381 | 475 | 626 | 1088 | 1055 | 904 | 922 | 778 | 421 | 490 | 308 | 657.83 |
| 1951 | 346 | 437 | 513 | 718 | 1180 | 1466 | 1314 | 1005 | 628 | 347 | 382 | 400 | 728 |
| 1952 | 339 | 329 | 770 | 1112 | 994 | 1225 | 912 | 798 | 760 | 712 | 772 | 555 | 773.17 |
| 1953 | 336 | 339 | 442 | 717 | 1024 | 1131 | 1515 | 1047 | 569 | 432 | 305 | 239 | 674.67 |
| 1954 | 362 | 276 | 429 | 631 | 1124 | 1422 | 2213 | 1054 | 801 | 838 | 562 | 513 | 852.08 |
| 1955 | 528 | 462 | 495 | 913 | 1180 | 1454 | 1704 | 1051 | 797 | 509 | 372 | 414 | 823.25 |
| 1956 | 383 | 281 | 719 | 610 | 970 | 1404 | 1198 | 1193 | 993 | 593 | 507 | 557 | 784 |
| 1957 | 391 | 487 | 619 | 707 | 761 | 1283 | 1408 | 1156 | 768 | 464 | 328 | 300 | 722.67 |
| 1958 | 291 | 635 | 448 | 657 | 1216 | 1183 | 1029 | 878 | 632 | 752 | 584 | 396 | 725.08 |
| 1959 | 440 | 359 | 483 | 677 | 891 | 1516 | 1420 | 1352 | 541 | 352 | 301 | 273 | 717.08 |
| 1960 | 343 | 391 | 646 | 593 | 986 | 1192 | 1113 | 1176 | 939 | 689 | 537 | 387 | 749.33 |
| 1961 | 312 | 439 | 503 | 719 | 1184 | 1321 | 1052 | 983 | 545 | 350 | 310 | 588 | 692.17 |
| 1962 | 416 | 434 | 400 | 774 | 1228 | 1473 | 1190 | 961 | 564 | 343 | 319 | 299 | 700.08 |
| 1963 | 259 | 217 | 421 | 679 | 859 | 1091 | 936 | 850 | 766 | 460 | 407 | 304 | 604.08 |
| 1964 | 239 | 278 | 364 | 602 | 1039 | 948 | 796 | 739 | 554 | 689 | 789 | 499 | 628 |
| 1965 | 410 | 346 | 591 | 908 | 1627 | 2372 | 1592 | 1084 | 928 | 500 | 346 | 444 | 929 |
| 1966 | 376 | 552 | 518 | 765 | 1255 | 1479 | 1678 | 1685 | 953 | 565 | 527 | 563 | 909.67 |
| 1967 | 513 | 545 | 725 | 937 | 1415 | 1679 | 1422 | 999 | 767 | 491 | 371 | 357 | 851.75 |
| 1968 | 452 | 416 | 474 | 904 | 911 | 1081 | 1177 | 1149 | 782 | 838 | 429 | 337 | 745.83 |
| 1969 | 338 | 346 | 385 | 544 | 881 | 915 | 915 | 897 | 607 | 338 | 295 | 276 | 561.42 |
| 1970 | 306 | 590 | 494 | 820 | 1226 | 1759 | 1410 | 1605 | 1004 | 737 | 578 | 482 | 917.58 |
| 1971 | 357 | 342 | 439 | 641 | 769 | 920 | 777 | 687 | 522 | 382 | 310 | 351 | 541.42 |
| 1972 | 273 | 265 | 284 | 507 | 625 | 964 | 1057 | 788 | 420 | 344 | 575 | 381 | 540.25 |
| 1973 | 278 | 312 | 399 | 558 | 1256 | 1145 | 900 | 657 | 532 | 518 | 585 | 537 | 639.75 |
| 1974 | 546 | 486 | 576 | 598 | 805 | 1237 | 1433 | 1004 | 715 | 624 | 521 | 887 | 786 |
| 1975 | 657 | 550 | 473 | 732 | 1360 | 1389 | 1926 | 1109 | 786 | 446 | 354 | 329 | 842.58 |
| 1976 | 463 | 351 | 336 | 460 | 731 | 1009 | 674 | 709 | 782 | 540 | 421 | 388 | 572 |
| 1977 | 362 | 693 | 705 | 832 | 1166 | 1126 | 990 | 1273 | 755 | 401 | 391 | 421 | 759.58 |
| 1978 | 357 | 332 | 577 | 591 | 886 | 1112 | 1202 | 776 | 749 | 722 | 437 | 365 | 675.5 |
| 1979 | 321 | 419 | 612 | 665 | 1067 | 1614 | 1191 | 1043 | 722 | 537 | 730 | 624 | 795.42 |
| 1980 | 402 | 540 | 444 | 789 | 1031 | 1368 | 1343 | 1012 | 675 | 686 | 464 | 436 | 765.83 |
| 1981 | 447 | 465 | 825 | 941 | 768 | 1002 | 1446 | 1022 | 761 | 804 | 665 | 630 | 814.67 |
| 1982 | 682 | 581 | 512 | 695 | 1103 | 1454 | 1122 | 954 | 674 | 466 | 372 | 371 | 748.83 |
| 1983 | 587 | 481 | 523 | 742 | 990 | 1225 | 1031 | 893 | 620 | 476 | 354 | 424 | 695.5 |
| 1984 | 388 | 369 | 361 | 528 | 791 | 974 | 936 | 830 | 843 | 599 | 351 | 315 | 607.08 |
| |
|
|
|
|
|
|
|
|
|
|
|
|
|
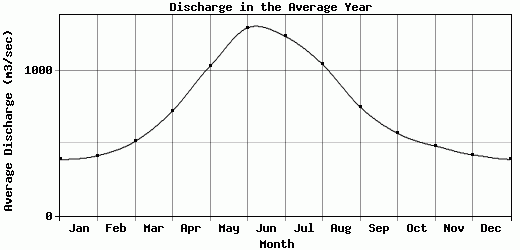
| Avg | 387.62 | 413.31 | 511.11 | 721.38 | 1029.44 | 1294.02 | 1235.75 | 1042.29 | 749.51 | 566.93 | 480.35 | 419.53 | 737.6 |
| |
|
|
|
|
|
|
|
|
|
|
|
|
|
| Std Dev | 111.6 |
130.05 |
142.12 |
182.13 |
231.09 |
285.5 |
298.66 |
219.77 |
157.22 |
163.88 |
151.37 |
130.96 |
104.81 |
| |
|
|
|
|
|
|
|
|
|
|
|
|
|
| | Jan | Feb | Mar | Apr | May | Jun | Jul | Aug | Sep | Oct | Nov | Dec | Avg Annual |
Click here for this table in tab-delimited format.
Tab-delimited format will open in most table browsing software, i.e. Excel, etc.
View this station on the map.
Return to start.