Results
| Country: | Japan
| | Station: | Ishikari- Ohashi | | River: | Ishikari | | Area: | 12697 km2 | | Lat: | 43.11 | | Lon: | 141.53 | | Source: | RivDIS | | PointID: | 173 | | Area Units: | km2 | | Discharge Units: | m3/sec | | Starting Year: | 1954 | | Ending Year: | 1984 | | Total Years: | 31 | | Total Usable Years: | 30 | |
| |
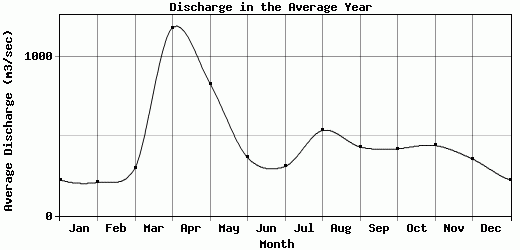
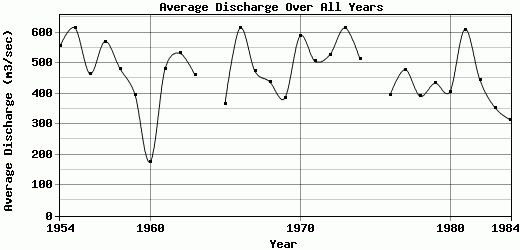
| Year | Jan | Feb | Mar | Apr | May | Jun | Jul | Aug | Sep | Oct | Nov | Dec | Avg Annual |
|---|
| 1954 | 200.9 | 200.9 | 283.7 | 1761.4 | 1003.5 | 386.2 | 252.8 | 885.3 | 450 | 339 | 419.9 | 471.7 | 554.61 |
| 1955 | 200.9 | 200.9 | 498.6 | 1432.4 | 795.3 | 417.3 | 661.2 | 842 | 489.8 | 750.8 | 687.4 | 401.6 | 614.85 |
| 1956 | 89.8 | 89.8 | 272.3 | 1413.3 | 935 | 490.9 | 359 | 596.2 | 299.3 | 323.9 | 427.9 | 275.1 | 464.38 |
| 1957 | 247.4 | 247.4 | 266.7 | 1614.7 | 1018.9 | 348.3 | 263.8 | 535.1 | 827.6 | 706.8 | 388.6 | 381.1 | 570.53 |
| 1958 | 247.4 | 247.4 | 343.5 | 1354 | 836.5 | 385.8 | 453.8 | 618.1 | 329.4 | 347.7 | 303.5 | 308.7 | 481.32 |
| 1959 | 194.8 | 194.8 | 328.9 | 1185.7 | 422.4 | 327.7 | 317.9 | 270.9 | 468.6 | 300.4 | 308.8 | 430.5 | 395.95 |
| 1960 | 118.6 | 110.9 | 127.1 | 195.8 | 293.9 | 112.4 | 108.1 | 275.5 | 255.8 | 164.4 | 172.5 | 174.3 | 175.78 |
| 1961 | 215 | 228 | 291.1 | 1430.8 | 1001.6 | 255.1 | 694.9 | 321 | 446.3 | 250.2 | 321.1 | 294.2 | 479.11 |
| 1962 | 145.2 | 275.5 | 161.7 | 1531.4 | 520.6 | 362.4 | 271.5 | 1426.3 | 602.2 | 401.1 | 344.9 | 335.4 | 531.52 |
| 1963 | 276.8 | 261.6 | 427.4 | 814.9 | 485.5 | 362.4 | 390.4 | 575.8 | 532.5 | 418.1 | 449.6 | 517.2 | 459.35 |
| 1964 | 288.5 | 161.9 | 268.7 | 1031.9 | 453.7 | 469.6 | 354.3 | 824.8 | 581 | 342.2 | 514.7 | -9999 | -9999 |
| 1965 | 194 | 146 | 312 | 328 | 448 | 342 | 379 | 249 | 785 | 436 | 372 | 410 | 366.75 |
| 1966 | 213 | 232 | 543 | 1573 | 1357 | 384 | 342 | 1058 | 390 | 435 | 540 | 302 | 614.08 |
| 1967 | 256 | 226 | 279 | 1260 | 904 | 412 | 504 | 292 | 419 | 414 | 361 | 343 | 472.5 |
| 1968 | 324 | 280 | 498 | 1020 | 532 | 289 | 214 | 441 | 725 | 379 | 284 | 266 | 437.67 |
| 1969 | 79 | 77.5 | 297 | 128 | 876 | 540 | 218 | 486 | 617 | 474 | 471 | 366 | 385.79 |
| 1970 | 172 | 182 | 356 | 1790 | 1810 | 406 | 253 | 375 | 319 | 457 | 606 | 327 | 587.75 |
| 1971 | 272 | 261 | 319 | 1160 | 674 | 448 | 377 | 358 | 549 | 707 | 521 | 419 | 505.42 |
| 1972 | 268 | 285 | 437 | 1526 | 721 | 444 | 323 | 344 | 419 | 539 | 569 | 457 | 527.67 |
| 1973 | 245 | 259 | 242 | 1889 | 1027 | 317 | 243 | 905 | 640 | 584 | 635 | 395 | 615.08 |
| 1974 | 242 | 232 | 208 | 1515 | 1133 | 528 | 246 | 437 | 319 | 437 | 555 | 292 | 512 |
| 1975 | -9999 | -9999 | -9999 | -9999 | -9999 | -9999 | -9999 | -9999 | -9999 | -9999 | -9999 | -9999 | -9999 |
| 1976 | 377 | 302 | 265 | 1031 | 738 | 256 | 142 | 223 | 195 | 305 | 555 | 343 | 394.33 |
| 1977 | 203 | 198 | 405 | 1128 | 1323 | 363 | 255 | 416 | 319 | 255 | 422 | 455 | 478.5 |
| 1978 | 295 | 252 | 282 | 1031 | 854 | 379 | 189 | 363 | 180 | 235 | 320 | 315 | 391.25 |
| 1979 | 220 | 210 | 221 | 943 | 791 | 409 | 256 | 216 | 254 | 701 | 599 | 385 | 433.75 |
| 1980 | 246 | 194 | 238 | 1064 | 995 | 299 | 172 | 194 | 226 | 319 | 511 | 415 | 406.08 |
| 1981 | 257 | 210 | 249 | 1181 | 738 | 351 | 422 | 1886 | 648 | 587 | 519 | 273 | 610.08 |
| 1982 | 245 | 197 | 227 | 1160 | 1189 | 406 | 218 | 286 | 306 | 264 | 377 | 441 | 443 |
| 1983 | 266 | 183 | 228 | 1170 | 351 | 241 | 213 | 226 | 269 | 469 | 324 | 298 | 353.17 |
| 1984 | 178 | 152 | 139 | 837 | 742 | 266 | 207 | 171 | 152 | 294 | 374 | 264 | 314.67 |
| |
|
|
|
|
|
|
|
|
|
|
|
|
|
| Avg | 225.91 | 209.92 | 300.49 | 1183.34 | 832.33 | 366.6 | 310.02 | 536.57 | 433.78 | 421.19 | 441.8 | 357.1 | 468.17 |
| |
|
|
|
|
|
|
|
|
|
|
|
|
|
| Std Dev | 63.47 |
55.12 |
100.87 |
422.15 |
327.59 |
88.79 |
133.81 |
384.29 |
181.24 |
151.89 |
120.42 |
76.65 |
100.12 |
| |
|
|
|
|
|
|
|
|
|
|
|
|
|
| | Jan | Feb | Mar | Apr | May | Jun | Jul | Aug | Sep | Oct | Nov | Dec | Avg Annual |
Click here for this table in tab-delimited format.
Tab-delimited format will open in most table browsing software, i.e. Excel, etc.
View this station on the map.
Return to start.