Results
| Country: | U.S.S.R.
| | Station: | Tulun | | River: | Iya | | Area: | 14500 km2 | | Lat: | 54.67 | | Lon: | 100.88 | | Source: | RivDIS | | PointID: | 152 | | Area Units: | km2 | | Discharge Units: | m3/sec | | Starting Year: | 1965 | | Ending Year: | 1984 | | Total Years: | 20 | | Total Usable Years: | 20 | |
| |
| Year | Jan | Feb | Mar | Apr | May | Jun | Jul | Aug | Sep | Oct | Nov | Dec | Avg Annual |
|---|
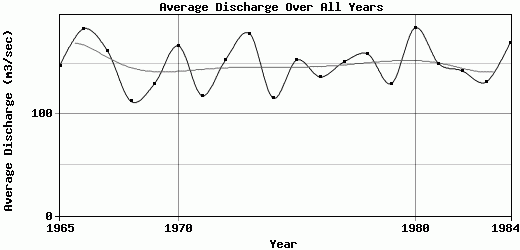
| 1965 | 21 | 15 | 11 | 12 | 389 | 256 | 291 | 290 | 270 | 145 | 42 | 35 | 148.08 |
| 1966 | 20 | 13 | 20 | 16 | 326 | 413 | 424 | 582 | 210 | 124 | 35 | 28 | 184.25 |
| 1967 | 14 | 13 | 12 | 80 | 248 | 336 | 297 | 545 | 238 | 118 | 28 | 25 | 162.83 |
| 1968 | 17 | 10 | 11 | 62 | 177 | 245 | 173 | 258 | 230 | 115 | 32 | 22 | 112.67 |
| 1969 | 13.5 | 7.9 | 9.4 | 69.5 | 288 | 287 | 222 | 232 | 208 | 122 | 68 | 35.5 | 130.23 |
| 1970 | 20 | 20 | 16 | 67.5 | 329 | 415 | 367 | 259 | 234 | 178 | 64.5 | 40.5 | 167.54 |
| 1971 | 20 | 13.5 | 8.8 | 55.5 | 146 | 193 | 231 | 356 | 208 | 111 | 48 | 29 | 118.32 |
| 1972 | 20 | 12 | 8.2 | 56.5 | 157 | 399 | 444 | 295 | 245 | 110 | 52 | 47.5 | 153.85 |
| 1973 | 29.5 | 19 | 18.5 | 109 | 294 | 619 | 454 | 294 | 165 | 79.6 | 42 | 33 | 179.72 |
| 1974 | 17.5 | 6.2 | 5 | 53.5 | 231 | 298 | 225 | 190 | 182 | 122 | 37 | 24.2 | 115.95 |
| 1975 | 19.5 | 15.5 | 13 | 54 | 277 | 318 | 259 | 359 | 320 | 134 | 42.5 | 30 | 153.46 |
| 1976 | 21.5 | 17 | 20 | 32.5 | 196 | 351 | 371 | 341 | 156 | 76.5 | 32 | 27 | 136.79 |
| 1977 | 14.5 | 10 | 8 | 48.5 | 223 | 506 | 393 | 282 | 156 | 90.5 | 52 | 36.5 | 151.67 |
| 1978 | 23.5 | 17 | 17.5 | 66 | 223 | 469 | 368 | 364 | 206 | 85 | 44.5 | 28.5 | 159.33 |
| 1979 | 17 | 13.5 | 14.5 | 34 | 330 | 278 | 179 | 221 | 249 | 138 | 46 | 42.5 | 130.21 |
| 1980 | 27.5 | 18 | 17 | 49.5 | 305 | 453 | 248 | 757 | 183 | 102 | 33.5 | 29 | 185.21 |
| 1981 | 18.5 | 19 | 19 | 97 | 188 | 275 | 217 | 532 | 219 | 116 | 56 | 40.5 | 149.75 |
| 1982 | 18.5 | 12.5 | 9.7 | 97 | 362 | 364 | 320 | 173 | 169 | 105 | 41.5 | 40 | 142.68 |
| 1983 | 26.5 | 17 | 13 | 16.5 | 156 | 321 | 279 | 251 | 279 | 136 | 52.5 | 35 | 131.88 |
| 1984 | 32.5 | 20 | 14 | 27.5 | 248 | 257 | 731 | 383 | 162 | 98 | 43.5 | 24.5 | 170.08 |
| |
|
|
|
|
|
|
|
|
|
|
|
|
|
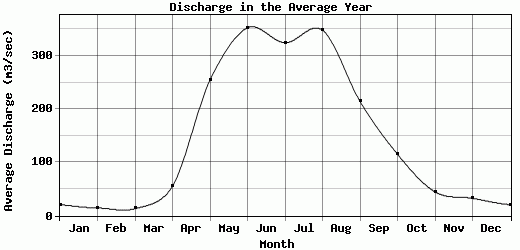
| Avg | 20.6 | 14.46 | 13.28 | 55.2 | 254.65 | 352.65 | 324.65 | 348.2 | 214.45 | 115.28 | 44.63 | 32.66 | 149.23 |
| |
|
|
|
|
|
|
|
|
|
|
|
|
|
| Std Dev | 4.95 |
3.89 |
4.32 |
26.68 |
70.43 |
101.2 |
125.64 |
144.99 |
43.61 |
23.69 |
10.38 |
6.87 |
21.42 |
| |
|
|
|
|
|
|
|
|
|
|
|
|
|
| | Jan | Feb | Mar | Apr | May | Jun | Jul | Aug | Sep | Oct | Nov | Dec | Avg Annual |
Click here for this table in tab-delimited format.
Tab-delimited format will open in most table browsing software, i.e. Excel, etc.
View this station on the map.
Return to start.