The rolling landscape of Wisconsin represents a complex mosaic of agricultural land (pastures and cropping systems), forests, prairies, lakes, and urban centers. It is well documented that the conversion of pristine tallgrass prairies and oak-savannas in the mid-1800s to agriculture via European settlement led to a significant loss (up to 60%) of the soil organic matter on our land. This release of CO2 to the atmosphere was a primary cause of the observed rise in atmospheric CO2 concentrations until about 1950 when fossil fuel combustion began to outpace agricultural related carbon emissions.
Today, we understand that better farm management practices (e.g., reduced tillage, crop rotation, cover crops) coupled with ecosystem preservation and rehabilitation (e.g. prairie restoration) offer a means to help control soil erosion and degradation while having the potential to sequester carbon back from the atmosphere, storing it within our soils. Carbon sequestration by terrestrial ecosystems is one means by which we may help to mitigate the greenhouse effect in the near future (i.e. next 20-50 years) by helping to curtail atmospheric CO2 levels.
Moreover, the associated increase in the soil organic matter would also have significant positive feedbacks to the health and long-term sustainability of our agricultural land by enhancing the soil fertility, improving soil structure, and aiding in water holding capacity.
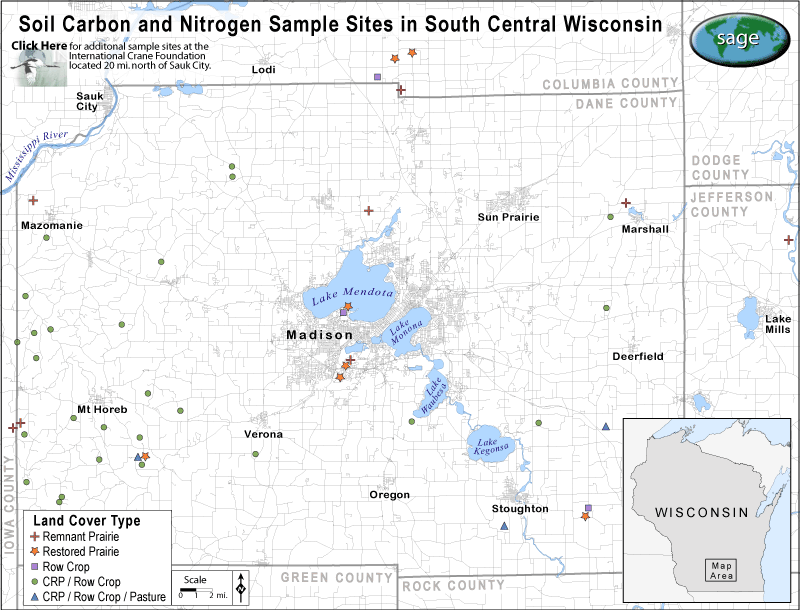
In order to gain a better understanding of the impacts of varied land management on soil carbon and nitrogen storage in southern Wisconsin, scientists at SAGE have initiated a long-term campaign of soil sampling and monitoring. In 1999, we began collecting soil carbon, nitrogen, bulk density and other assorted data on land-use history for agricultural land across southcentral Wisconsin.
Since the initiation of this campaign, we have sampled over 125 sites that include traditional cropping systems, land enrolled in the Conservation Reserve Program (CRP), restored and remnant prairie ecosystems, and pastures. The majority of these sites are located in Sauk, Columbia, Dane, and Jefferson counties.
The following searchable database allows for access to these data. This research has been supported by S.C. Johnson and Sons Inc., Madison Gas and Electric Corp (MGE), and The Barker Fund through the UW-Madison Foundation and College of Agricultural and Life Sciences.
Click on the map to select the sites that you are interested in.
View the Wiscland cover classification for southern Wisconsin.